
Page 735 - Read Online
P. 735
Page 4 of 24 Palacios Mini-invasive Surg 2020;4:73 I http://dx.doi.org/10.20517/2574-1225.2020.72
Figure 1. Video loops from a patient with severe mitral stenosis and a low Echo Score of 5 (right panel) and a high Echo Score of 10 (left
panel)
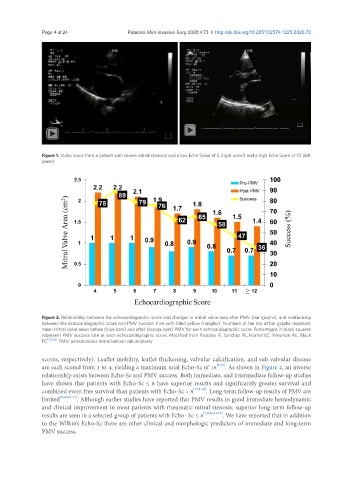
Figure 2. Relationship between the echocardiographic score and changes in mitral valve area after PMV (bar graphs), and relationship
between the echocardiographic score and PMV success (line with filled yellow triangles). Numbers at the top of bar graphs represent
mean mitral valve areas before (blue bars) and after (orange bars) PMV for each echocardiographic score. Percentages in black squares
represent PMV success rate at each echocardiographic score. Modified from Palacios IF, Sanchez PL, Harrell LC, Weyman AE, Block
PC [1,13,18] . PMV: percutaneous mitral balloon valvuloplasty
scores, respectively). Leaflet mobility, leaflet thickening, valvular calcification, and sub valvular disease
are each scored from 1 to 4, yielding a maximum total Echo-Sc of 16 [9,12] . As shown in Figure 2, an inverse
relationship exists between Echo-Sc and PMV success. Both immediate, and intermediate follow-up studies
have shown that patients with Echo-Sc ≤ 8 have superior results and significantly greater survival and
combined event free survival than patients with Echo-Sc > 8 [7,12-14] . Long-term follow-up results of PMV are
limited [9,10,15-17] . Although earlier studies have reported that PMV results in good immediate hemodynamic
and clinical improvement in most patients with rheumatic mitral stenosis, superior long-term follow-up
results are seen in a selected group of patients with Echo- Sc ≤ 8 [7,8,10,12,15] . We have reported that in addition
to the Wilkin’s Echo-Sc there are other clinical and morphologic predictors of immediate and long-term
PMV success.