
Page 65 - Read Online
P. 65
Aslam et al. Mini-invasive Surg 2018;2:10 I http://dx.doi.org/10.20517/2574-1225.2017.42 Page 3 of 7
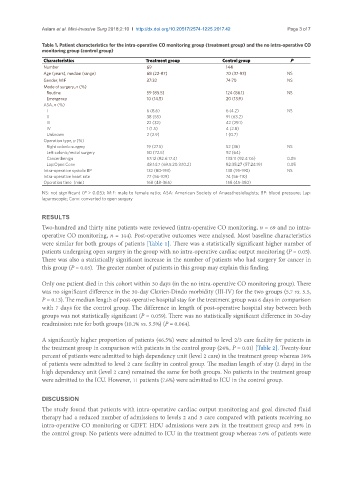
Table 1. Patient characteristics for the intra-operative CO monitoring group (treatment group) and the no intra-operative CO
monitoring group (control group)
Characteristics Treatment group Control group P
Number 69 144
Age (years), median (range) 68 (22-87) 70 (37-93) NS
Gender, M:F 37:32 74:70 NS
Mode of surgery, n (%)
Routine 59 (85.5) 124 (86.1) NS
Emergency 10 (14.5) 20 (13.9)
ASA, n (%)
I 6 (8.6) 6 (4.2) NS
II 38 (55) 91 (63.2)
III 22 (32) 42 (29.1)
IV 1 (1.5) 4 (2.8)
Unknown 2 (2.9) 1 (0.7)
Operation type, n (%)
Right colonic surgery 19 (27.5) 52 (36) NS
Left colonic/rectal surgery 50 (72.5) 92 (64)
Cancer:benign 57:12 (82.6:17.4) 133:11 (92.4:7.6) 0.05
Lap:Open:Conv 48:14:7 (69.5:20.3:10.2) 82:35:27 (57:24:19) 0.05
Intra-operative systolic BP 132 (80-193) 138 (95-190) NS
Intra-operative heart rate 77 (56-109) 74 (56-110)
Operation time (min) 168 (48-365) 158 (45-380)
NS: not significant (P > 0.05); M:F: male to female ratio; ASA: American Society of Anaesthesiologists; BP: blood pressure; Lap:
laparoscopic; Conv: converted to open surgery
RESULTS
Two-hundred and thirty nine patients were reviewed (intra-operative CO monitoring, n = 69 and no intra-
operative CO monitoring, n = 144). Post-operative outcomes were analysed. Most baseline characteristics
were similar for both groups of patients [Table 1]. There was a statistically significant higher number of
patients undergoing open surgery in the group with no intra-operative cardiac output monitoring (P = 0.05).
There was also a statistically significant increase in the number of patients who had surgery for cancer in
this group (P = 0.05). The greater number of patients in this group may explain this finding.
Only one patient died in this cohort within 30 days (in the no intra-operative CO monitoring group). There
was no significant difference in the 30-day Clavien-Dindo morbidity (III-IV) for the two groups (5.7 vs. 5.5,
P = 0.13). The median length of post-operative hospital stay for the treatment group was 6 days in comparison
with 7 days for the control group. The difference in length of post-operative hospital stay between both
groups was not statistically significant (P = 0.059). There was no statistically significant difference in 30-day
readmission rate for both groups (10.1% vs. 5.5%) (P = 0.064).
A significantly higher proportion of patients (46.5%) were admitted to level 2/3 care facility for patients in
the treatment group in comparison with patients in the control group (24%, P = 0.01) [Table 2]. Twenty-four
percent of patients were admitted to high dependency unit (level 2 care) in the treatment group whereas 39%
of patients were admitted to level 2 care facility in control group. The median length of stay (2 days) in the
high dependency unit (level 2 care) remained the same for both groups. No patients in the treatment group
were admitted to the ICU. However, 11 patients (7.6%) were admitted to ICU in the control group.
DISCUSSION
The study found that patients with intra-operative cardiac output monitoring and goal directed fluid
therapy had a reduced number of admissions to levels 2 and 3 care compared with patients receiving no
intra-operative CO monitoring or GDFT. HDU admissions were 24% in the treatment group and 39% in
the control group. No patients were admitted to ICU in the treatment group whereas 7.6% of patients were