
Page 215 - Read Online
P. 215
Riaz et al. Mini-invasive Surg 2018;2:28 I http://dx.doi.org/10.20517/2574-1225.2018.41 Page 5 of 8
20 candidates
Kinaesthetic training
5 motions dominant
5 motions non-dominant
Baseline assessment
10 candidates 10 candidates
Mental training group Control group
Displayed Distraction laparoscopic exer-
Instructions cise
Dominant hand Non-dominant hand Dominant hand Non-dominant hand
Final task Final task Final task Final task
Final assessment Final assessment Final assessment Final assessment
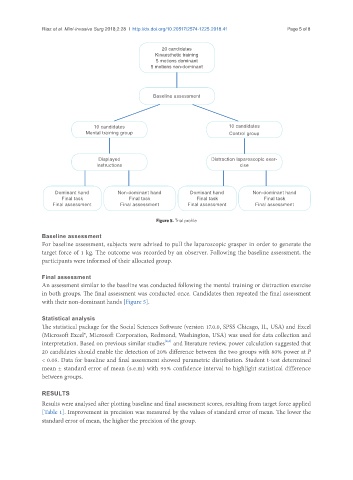
Figure 5. Trial profile
Baseline assessment
For baseline assessment, subjects were advised to pull the laparoscopic grasper in order to generate the
target force of 1 kg. The outcome was recorded by an observer. Following the baseline assessment, the
participants were informed of their allocated group.
Final assessment
An assessment similar to the baseline was conducted following the mental training or distraction exercise
in both groups. The final assessment was conducted once. Candidates then repeated the final assessment
with their non-dominant hands [Figure 5].
Statistical analysis
The statistical package for the Social Sciences Software (version 17.0.0, SPSS Chicago, IL, USA) and Excel
(Microsoft Excel®, Microsoft Corporation, Redmond, Washington, USA) was used for data collection and
interpretation. Based on previous similar studies and literature review, power calculation suggested that
[2,3]
20 candidates should enable the detection of 20% difference between the two groups with 80% power at P
< 0.05. Data for baseline and final assessment showed parametric distribution. Student t-test determined
mean ± standard error of mean (s.e.m) with 95% confidence interval to highlight statistical difference
between groups.
RESULTS
Results were analysed after plotting baseline and final assessment scores, resulting from target force applied
[Table 1]. Improvement in precision was measured by the values of standard error of mean. The lower the
standard error of mean, the higher the precision of the group.