
Page 12 - Read Online
P. 12
van Wiechen et al. Mini-invasive Surg 2022;6:1 https://dx.doi.org/10.20517/2574-1225.2021.96 Page 5 of 11
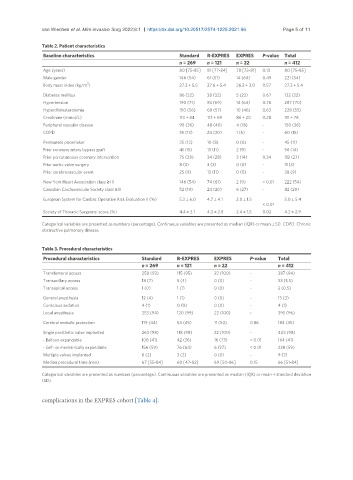
Table 2. Patient characteristics
Baseline characteristics Standard R-EXPRES EXPRES P-value Total
n = 269 n = 121 n = 22 n = 412
Age (years) 80 [75-85] 81 [77-84] 78 [73-81] 0.13 80 [75-85]
Male gender 146 (54) 61 (51) 14 (64) 0.49 221 (54)
2
Body mass index (kg/m ) 27.3 ± 5.5 27.6 ± 5.4 26.2 ± 3.0 0.57 27.3 ± 5.4
Diabetes mellitus 86 (32) 38 (32) 5 (23) 0.67 132 (32)
Hypertension 190 (71) 83 (69) 14 (64) 0.76 287 (70)
Hypercholesterolemia 150 (56) 68 (57) 10 (46) 0.63 228 (55)
Creatinine (mmol/L) 113 ± 84 113 ± 69 86 ± 20 0.28 111 ± 78
Peripheral vascular disease 98 (36) 48 (40) 4 (18) - 150 (36)
COPD 35 (13) 24 (20) 1 (5) - 60 (15)
Permanent pacemaker 35 (13) 10 (8) 0 (0) - 45 (11)
Prior coronary artery bypass graft 41 (15) 13 (11) 2 (9) - 56 (14)
Prior percutaneous coronary intervention 75 (28) 34 (28) 3 (14) 0.34 112 (27)
Prior aortic valve surgery 8 (3) 3 (3) 0 (0) - 11 (3)
Prior cerebrovascular event 25 (9) 13 (11) 0 (0) - 38 (9)
New York Heart Association class ≥ III 146 (54) 74 (61) 2 (9) < 0.01 222 (54)
Canadian Cardiovascular Society class ≥ II 52 (19) 24 (20) 6 (27) - 82 (20)
European System for Cardiac Operative Risk Evaluation II (%) 5.3 ± 6.0 4.7 ± 4.1 2.0 ± 1.5 5.0 ± 5.4
< 0.01
Society of Thoracic Surgeons’ score (%) 4.4 ± 3.1 4.3 ± 2.8 2.4 ± 1.5 0.02 4.2 ± 2.9
Categorical variables are presented as numbers (percentage). Continuous variables are presented as median (IQR) or mean ± SD. COPD: Chronic
obstructive pulmonary disease.
Table 3. Procedural characteristics
Procedural characteristics Standard R-EXPRES EXPRES P-value Total
n = 269 n = 121 n = 22 n = 412
Transfemoral access 250 (93) 115 (95) 22 (100) - 387 (94)
Transaxillary access 18 (7) 5 (4) 0 (0) - 23 (5.5)
Transapical access 1 (0) 1 (1) 0 (0) - 2 (0.5)
General anesthesia 12 (4) 1 (1) 0 (0) - 13 (3)
Conscious sedation 4 (1) 0 (0) 0 (0) - 4 (1)
Local anesthesia 253 (94) 120 (99) 22 (100) - 395 (96)
Cerebral embolic protection 119 (44) 54 (45) 11 (50) 0.86 184 (45)
Single prosthetic valve implanted 263 (98) 118 (98) 22 (100) - 403 (98)
- Balloon expandable 106 (41) 42 (36) 16 (73) < 0.01 164 (41)
- Self- or mechanically expandable 156 (59) 76 (64) 6 (27) < 0.01 238 (59)
Multiple valves implanted 6 (2) 3 (2) 0 (0) - 9 (2)
Median procedural time (min) 67 [55-84] 60 [47-82] 69 [50-86] 0.15 66 [51-84]
Categorical variables are presented as numbers (percentage). Continuous variables are presented as median (IQR) or mean ± standard deviation
(SD).
complications in the EXPRES cohort [Table 4].