
Page 12 - Read Online
P. 12
Cosgun et al. Mini-invasive Surg 2019;3:32 I http://dx.doi.org/10.20517/2574-1225.2019.024 Page 5 of 9
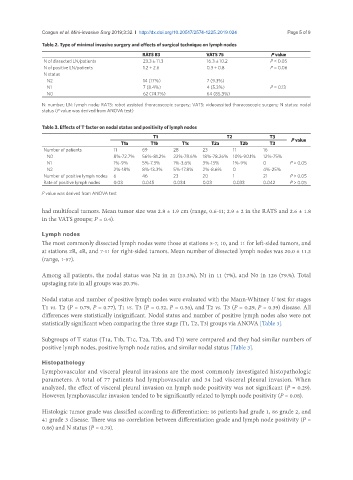
Table 2. Type of minimal invasive surgery and effects of surgical technique on lymph nodes
RATS 83 VATS 75 P value
N of dissected LN/patients 23.3 ± 11.3 16.3 ± 10.2 P < 0.05
N of positive LN/patients 1.2 ± 2.6 0.3 ± 0.8 P = 0.06
N status
N2 14 (17%) 7 (9.3%)
N1 7 (8.4%) 4 (5.3%) P = 0.13
N0 62 (74.7%) 64 (85.3%)
N: number; LN: lymph node; RATS: robot assisted thoracoscopic surgery; VATS: videoassited thoracoscopic surgery; N status: nodal
status (P value was derived from ANOVA test)
Table 3. Effects of T factor on nodal status and positivity of lymph nodes
T1 T2 T3
T1a T1b T1c T2a T2b T3 P value
Number of patients 11 69 28 23 11 16
N0 8%-72.7% 56%-81.2% 22%-78.6% 18%-78.26% 10%-90.1% 12%-75%
N1 1%-9% 5%-7.3% 1%-3.6% 3%-13% 1%-9% 0 P > 0.05
N2 2%-18% 8%-13.3% 5%-17.8% 2%-8.6% 0 4%-25%
Number of positive lymph nodes 6 46 23 20 1 21 P > 0.05
Rate of positive lymph nodes 0.03 0.045 0.034 0.03 0.033 0.042 P > 0.05
P value was derived from ANOVA test
had multifocal tumors. Mean tumor size was 2.8 ± 1.9 cm (range, 0.6-11; 2.9 ± 2 in the RATS and 2.6 ± 1.8
in the VATS groups; P = 0.4).
Lymph nodes
The most commonly dissected lymph nodes were those at stations 5-7, 10, and 11 for left-sided tumors, and
at stations 2R, 4R, and 7-11 for right-sided tumors. Mean number of dissected lymph nodes was 20.0 ± 11.3
(range, 1-57).
Among all patients, the nodal status was N2 in 21 (13.3%), N1 in 11 (7%), and N0 in 126 (79.%). Total
upstaging rate in all groups was 20.3%.
Nodal status and number of positive lymph nodes were evaluated with the Mann-Whitney U test for stages
T1 vs. T2 (P = 0.79, P = 0.77), T1 vs. T3 (P = 0.32, P = 0.36), and T2 vs. T3 (P = 0.29, P = 0.39) disease. All
differences were statistically insignificant. Nodal status and number of positive lymph nodes also were not
statistically significant when comparing the three stage (T1, T2, T3) groups via ANOVA [Table 3].
Subgroups of T status (T1a, T1b, T1c, T2a, T2b, and T3) were compared and they had similar numbers of
positive lymph nodes, positive lymph node ratios, and similar nodal status [Table 3].
Histopathology
Lymphovascular and visceral pleural invasions are the most commonly investigated histopathologic
parameters. A total of 77 patients had lymphovascular and 34 had visceral pleural invasion. When
analyzed, the effect of visceral pleural invasion on lymph node positivity was not significant (P = 0.29).
However, lymphovascular invasion tended to be significantly related to lymph node positivity (P = 0.08).
Histologic tumor grade was classified according to differentiation: 16 patients had grade 1, 86 grade 2, and
41 grade 3 disease. There was no correlation between differentiation grade and lymph node positivity (P =
0.86) and N status (P = 0.79).