
Page 56 - Read Online
P. 56
Pennestrì et al. Mini-invasive Surg. 2025;9:16 https://dx.doi.org/10.20517/2574-1225.2025.03 Page 9 of 13
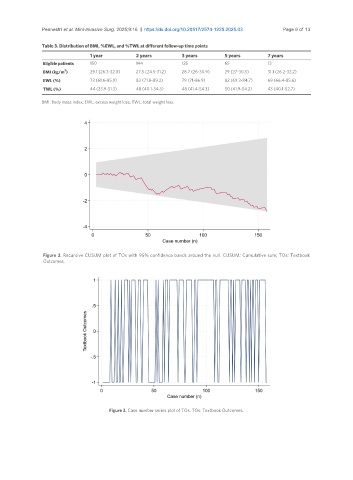
Table 3. Distribution of BMI, %EWL, and %TWL at different follow-up time points
1 year 2 years 3 years 5 years 7 years
Eligible patients 150 144 125 65 13
2
BMI (kg/m ) 29.1 (26.3-32.8) 27.5 (24.5-31.2) 28.7 (26-30.9) 29 (27-30.5) 31.1 (26.2-32.2)
EWL (%) 73 (61.6-85.9) 82 (71.8-89.2) 79 (71-86.9) 82 (69.3-84.7) 69 (66.4-85.6)
TWL (%) 44 (33.9-51.3) 48 (40.1-54.3) 48 (41.4-54.3) 50 (41.9-54.2) 43 (40.1-52.7)
BMI: Body mass index; EWL: excess weight loss; TWL: total weight loss.
Figure 2. Recursive CUSUM plot of TOs with 95% confidence bands around the null. CUSUM: Cumulative sum; TOs: Textbook
Outcomes.
Figure 3. Case number series plot of TOs. TOs: Textbook Outcomes.