
Page 19 - Read Online
P. 19
Jafri et al. J Transl Genet Genom 2022;6:281-9 https://dx.doi.org/10.20517/jtgg.2021.63 Page 285
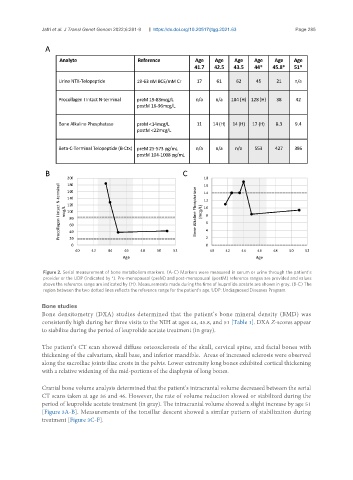
Figure 2. Serial measurement of bone metabolism markers. (A-C) Markers were measured in serum or urine through the patient’s
provider or the UDP (indicated by *). Pre-menopausal (preM) and post-menopausal (postM) reference ranges are provided and values
above the reference range are indicated by (H). Measurements made during the time of leuprolide acetate are shown in gray. (B-C) The
region between the two dotted lines reflects the reference range for the patient’s age. UDP: Undiagnosed Diseases Program.
Bone studies
Bone densitometry (DXA) studies determined that the patient’s bone mineral density (BMD) was
consistently high during her three visits to the NIH at ages 44, 45.8, and 51 [Table 1]. DXA Z-scores appear
to stabilize during the period of leuprolide acetate treatment (in gray).
The patient’s CT scan showed diffuse osteosclerosis of the skull, cervical spine, and facial bones with
thickening of the calvarium, skull base, and inferior mandible. Areas of increased sclerosis were observed
along the sacroiliac joints iliac crests in the pelvis. Lower extremity long bones exhibited cortical thickening
with a relative widening of the mid-portions of the diaphysis of long bones.
Cranial bone volume analysis determined that the patient’s intracranial volume decreased between the serial
CT scans taken at age 36 and 46. However, the rate of volume reduction slowed or stabilized during the
period of leuprolide acetate treatment (in gray). The intracranial volume showed a slight increase by age 51
[Figure 3A-B]. Measurements of the tonsillar descent showed a similar pattern of stabilization during
treatment [Figure 3C-F].