
Page 48 - Read Online
P. 48
Page 82 Schmidt et al. J Transl Genet Genom 2024;8:77-84 https://dx.doi.org/10.20517/jtgg.2023.43
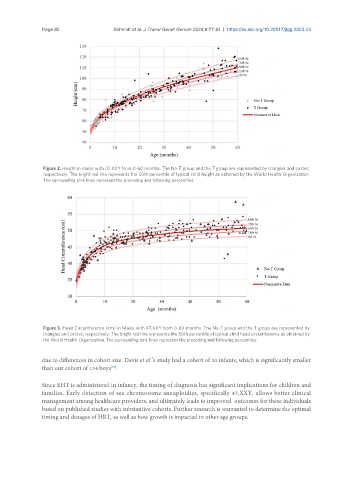
Figure 2. Height in males with 47,XXY from 0-60 months. The No-T group and the T group are represented by triangles and circles,
respectively. The bright red line represents the 50th percentile of typical child height as obtained by the World Health Organization.
The surrounding pink lines represent the preceding and following percentiles.
Figure 3. Head Circumference (cm) in Males with 47,XXY from 0-60 months. The No-T group and the T group are represented by
triangles and circles, respectively. The bright red line represents the 50th percentile of typical child head circumference as obtained by
the World Health Organization. The surrounding pink lines represent the preceding and following percentiles.
due to differences in cohort size. Davis et al.’s study had a cohort of 20 infants, which is significantly smaller
than our cohort of 134 boys .
[19]
Since EHT is administered in infancy, the timing of diagnosis has significant implications for children and
families. Early detection of sex chromosome aneuploidies, specifically 47,XXY, allows better clinical
management among healthcare providers, and ultimately leads to improved outcomes for these individuals
based on published studies with substantive cohorts. Further research is warranted to determine the optimal
timing and dosages of HRT, as well as how growth is impacted in other age groups.