
Page 47 - Read Online
P. 47
Schmidt et al. J Transl Genet Genom 2024;8:77-84 https://dx.doi.org/10.20517/jtgg.2023.43 Page 81
Table 1. Anthropometric growth patterns of boys with 47,XXY: comparing testosterone (T) vs. No testosterone (No-T)
Birth-12 mo. 13-24 mo. 25-36 mo. 37-48 mo. 49-60 mo.
T No-T T No-T T No-T T No-T T No-T
(n = 44) (n= 43) (n = 48) (n = 16) (n = 35) (n = 11) (n = 24) (n = 10) (n = 24) (n = 13)
HC (cm) Mean 42.8 39.9 47.5 47.8 48.6 48.6 50.3 50.3 49.3 53.2
SD 6.8 5.2 1.3 1.8 5.6 1.3 1.8 2.0 6.8 3.6
P-Value 0.028* 0.47 0.49 0.48 0.13
HT (cm) Mean 67.3 62.2 81.8 86.9 91.7 89.7 109.5 97.3 110.7 106.9
SD 12.7 6.4 5.6 15.7 4.6 6.1 43.2 5.3 8.1 4.6
P-Value 0.047* 0.065 0.11 0.5 0.09
WT (kg) Mean 8.5 6.4 11.5 13.2 14.3 13.2 16.6 15.5 20.0 18.0
SD 1.7 1.6 1.9 3.9 2.0 2.1 2.0 1.9 0.5 3.7
P-Value < 0.05* 0.048* 0.07 0.35 0.14
*P < 0.05.
Table 2. Demographics
T No-T
(n = 175) (n = 93)
Mean SD Mean SD P-Value
Birth weight (kg) 3.10 0.575 3.04 1.12 0.72
Maternal age (years) 35.35 5.47 34.81 5.11 0.565
Paternal age (years) 36.60 6.03 36.66 5.60 0.955
Maternal education scale 5.22 1.17 5.46 0.78 0.256
Paternal education scale 4.91 1.61 5.23 1.54 0.333
Maternal and Paternal Education Scales: 1: Didn't finish high school; 2: High school; 3: Some college, didn't finish; 4: 2-year college, associates; 5:
College; 6: Grad school; 7: MD, PhD, Law school.
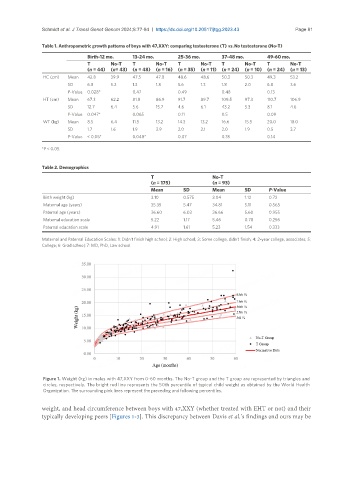
Figure 1. Weight (kg) in males with 47,XXY from 0-60 months. The No-T group and the T group are represented by triangles and
circles, respectively. The bright red line represents the 50th percentile of typical child weight as obtained by the World Health
Organization. The surrounding pink lines represent the preceding and following percentiles.
weight, and head circumference between boys with 47,XXY (whether treated with EHT or not) and their
typically developing peers [Figures 1-3]. This discrepancy between Davis et al.’s findings and ours may be