
Page 11 - Read Online
P. 11
Julka et al. J Transl Genet Genom 2020;4:455-63 I http://dx.doi.org/10.20517/jtgg.2020.46 Page 459
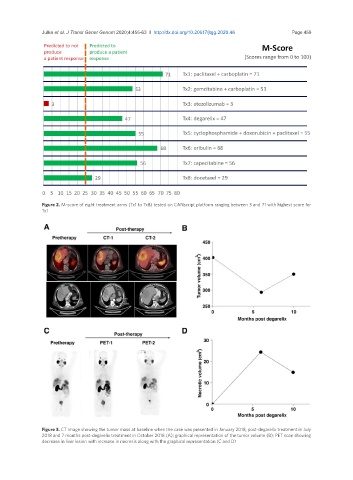
Figure 2. M-score of eight treatment arms (Tx1 to Tx8) tested on CANscript platform ranging between 3 and 71 with highest score for
Tx1
Figure 3. CT image showing the tumor mass at baseline when the case was presented in January 2018, post-degarelix treatment in July
2018 and 7 months post-degarelix treatment in October 2018 (A); graphical representation of the tumor volume (B); PET scan showing
decrease in liver lesion with increase in necrosis along with the graphical representation (C and D)