
Page 46 - Read Online
P. 46
Page 281 Hervas et al. J Transl Genet Genom 2021;5:278-87 https://dx.doi.org/10.20517/jtgg.2021.25
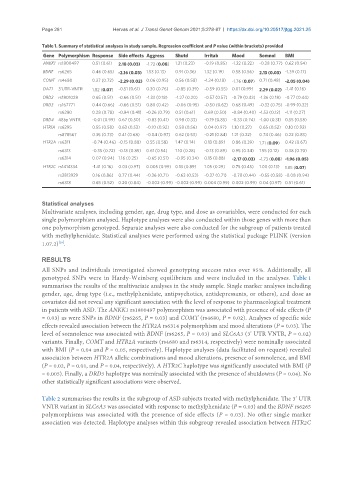
Table 1. Summary of statistical analyses in study sample. Regression coefficient and P value (within brackets) provided
Gene Polymorphism Response Side effects Aggress Shutd Irritab Mood Somnol BMI
ANKK1 rs1800497 0.51 (0.61) 2.18 (0.03) -1.72 (0.08) 1.21 (0.23) -0.19 (0.85) -1.22 (0.22) -0.28 (0.77) 0.62 (0.54)
BDNF rs6265 0.46 (0.65) -2.16 (0.03) 1.53 (0.13) 0.91 (0.36) 1.32 (0.19) 0.58 (0.56) 2.13 (0.03) -1.39 (0.17)
COMT rs4680 0.37 (0.72) -2.29 (0.02) 0.06 (0.95) 0.56 (0.58) -1.34 (0.18) -1.76 (0.07) 0.71 (0.48) -2.05 (0.04)
DAT1 3’UTR-VNTR 1.82 (0.07) -0.51 (0.61) 0.30 (0.76) -0.85 (0.39) -0.59 (0.55) 0.01 (0.99) 2.29 (0.02) -1.41 (0.16)
DRD2 rs1801028 0.65 (0.51) -0.66 (0.51) -1.33 (0.18) -1.27 (0.20) -0.57 (0.57) -0.79 (0.43) -1.36 (0.18) -0.77 (0.44)
DRD3 rs167771 0.44 (0.66) -0.66 (0.51) 0.80 (0.42) -0.06 (0.95) -0.50 (0.62) 0.68 (0.49) -0.32 (0.75) -0.99 (0.32)
rs6280 0.28 (0.78) -0.84 (0.41) -0.26 (0.79) 0.51 (0.61) 0.69 (0.50) -0.84 (0.40) -1.53 (0.12) -1.11 (0.27)
DRD4 48bp VNTR -0.01 (0.99) 0.67 (0.50) -0.83 (0.41) 0.98 (0.33) -0.19 (0.85) -0.33 (0.74) -1.00 (0.31) 0.55 (0.58)
HTR1A rs6295 0.55 (0.58) 0.63 (0.53) -0.10 (0.92) 0.58 (0.56) 0.04 (0.97) 1.10 (0.27) 0.65 (0.52) 0.10 (0.92)
rs878567 0.35 (0.73) 0.41 (0.68) -0.04 (0.97) 0.62 (0.53) -0.21 (0.84) 1.21 (0.22) 0.74 (0.46) 0.22 (0.83)
HTR2A rs6311 -0.74 (0.46) -0.15 (0.88) 0.55 (0.58) 1.47 (0.14) 0.13 (0.89) 0.86 (0.39) 1.71 (0.09) 0.42 (0.67)
rs6313 -0.35 (0.72) -0.18 (0.85) 0.61 (0.54) 1.10 (0.28) -0.13 (0.89) 0.95 (0.34) 1.55 (0.12) 0.38 (0.70)
rs6314 0.07 (0.94) 1.16 (0.25) -0.65 (0.51) -0.95 (0.34) 0.15 (0.88) -2.17 (0.03) -1.73 (0.08) -1.96 (0.05)
HTR2C rs1414334 -1.41 (0.16) 0.03 (0.97) 0.005 (0.99) 0.13 (0.89) 1.05 (0.29) 0.75 (0.45) 1.00 (0.13) 1.85 (0.07)
rs3813929 0.16 (0.86) 0.77 (0.44) -0.36 (0.71) -0.63 (0.53) -0.37 (0.71) -0.78 (0.44) -0.55 (0.58) -0.08 (0.94)
rs6318 0.65 (0.52) 0.20 (0.84) -0.002 (0.99) -0.002 (0.99) 0.004 (0.99) 0.002 (0.99) 0.04 (0.97) 0.51 (0.61)
Statistical analyses
Multivariate analyses, including gender, age, drug type, and dose as covariables, were conducted for each
single polymorphism analysed. Haplotype analyses were also conducted within those genes with more than
one polymorphism genotyped. Separate analyses were also conducted for the subgroup of patients treated
with methylphenidate. Statistical analyses were performed using the statistical package PLINK (version
1.07.2) .
[16]
RESULTS
All SNPs and individuals investigated showed genotyping success rates over 95%. Additionally, all
genotyped SNPs were in Hardy-Weinberg equilibrium and were included in the analyses. Table 1
summarises the results of the multivariate analyses in the study sample. Single marker analyses including
gender, age, drug type (i.e., methylphenidate, antipsychotics, antidepressants, or others), and dose as
covariates did not reveal any significant association with the level of response to pharmacological treatment
in patients with ASD. The ANKK1 rs1800497 polymorphism was associated with presence of side effects (P
= 0.03) as were SNPs in BDNF (rs6265, P = 0.03) and COMT (rs4680, P = 0.02). Analyses of specific side
effects revealed association between the HTR2A rs6314 polymorphism and mood alterations (P = 0.03). The
level of somnolence was associated with BDNF (rs6265, P = 0.03) and SLC6A3 (3’ UTR VNTR, P = 0.02)
variants. Finally, COMT and HTR2A variants (rs4680 and rs6314, respectively) were nominally associated
with BMI (P = 0.04 and P = 0.05, respectively). Haplotype analyses (data facilitated on request) revealed
association between HTR2A allelic combinations and mood alterations, presence of somnolence, and BMI
(P = 0.02, P = 0.01, and P = 0.04, respectively). A HTR2C haplotype was significantly associated with BMI (P
= 0.005). Finally, a DRD3 haplotype was nominally associated with the presence of shutdowns (P = 0.04). No
other statistically significant associations were observed.
Table 2 summarises the results in the subgroup of ASD subjects treated with methylphenidate. The 3’ UTR
VNTR variant in SLC6A3 was associated with response to methylphenidate (P = 0.03) and the BDNF rs6265
polymorphisms was associated with the presence of side effects (P = 0.03). No other single marker
association was detected. Haplotype analyses within this subgroup revealed association between HTR2C