
Page 30 - Read Online
P. 30
Page 280 Amadori et al. J Transl Genet Genom 2020;4:278-84 I https://doi.org/10.20517/jtgg.2020.36
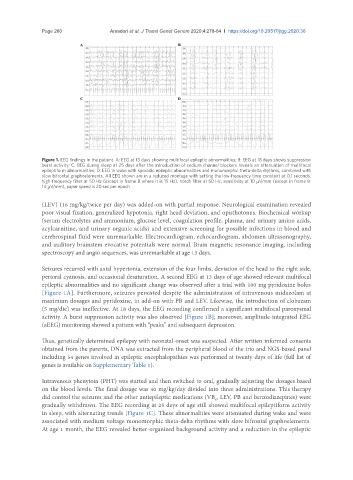
Figure 1. EEG findings in the patient. A: EEG at 13 days showing multifocal epileptic abnormalities; B: EEG at 18 days shows suppression
burst activity; C: EEG during sleep at 25 days after the introduction of sodium channel blockers reveals an attenuation of multifocal
epileptiform abnormalities; D: EEG in wake with sporadic epileptic abnormalities and monomorphic theta-delta rhythms, combined with
slow bifrontal graphoelements. All EEG shown are in a reduced montage with setting the low-frequency time constant at 0.1 seconds,
high-frequency filter at 50 Hz (except in frame B where it is 15 Hz), notch filter at 50 Hz, sensitivity at 10 μV/mm (except in frame B:
14 μV/mm), paper speed is 20 sec per epoch
(LEV) (16 mg/kg/twice per day) was added-on with partial response. Neurological examination revealed
poor visual fixation, generalized hypotonia, right head deviation, and opisthotonus. Biochemical workup
(serum electrolytes and ammonium, glucose level, coagulation profile, plasma, and urinary amino acids,
acylcarnitine, and urinary organic acids) and extensive screening for possible infections in blood and
cerebrospinal fluid were unremarkable. Electrocardiogram, echocardiogram, abdomen ultrasonography,
and auditory brainstem evocative potentials were normal. Brain magnetic resonance imaging, including
spectroscopy and angio sequences, was unremarkable at age 13 days.
Seizures recurred with axial hypertonia, extension of the four limbs, deviation of the head to the right side,
perioral cyanosis, and occasional desaturation. A second EEG at 13 days of age showed relevant multifocal
epileptic abnormalities and no significant change was observed after a trial with 100 mg pyridoxine bolus
[Figure 1A]. Furthermore, seizures persisted despite the administration of intravenous midazolam at
maximum dosages and pyridoxine, in add-on with PB and LEV. Likewise, the introduction of clobazam
(5 mg/die) was ineffective. At 18 days, the EEG recording confirmed a significant multifocal paroxysmal
activity. A burst suppression activity was also observed [Figure 1B]; moreover, amplitude-integrated EEG
(aEEG) monitoring showed a pattern with “peaks” and subsequent depression.
Thus, genetically determined epilepsy with neonatal-onset was suspected. After written informed consents
obtained from the parents, DNA was extracted from the peripheral blood of the trio and NGS-based panel
including 54 genes involved in epileptic encephalopathies was performed at twenty days of life (full list of
genes is available on Supplementary Table 1).
Intravenous phenytoin (PHT) was started and then switched to oral, gradually adjusting the dosages based
on the blood levels. The final dosage was 40 mg/kg/day divided into three administrations. This therapy
did control the seizures and the other antiepileptic medications (VB , LEV, PB and benzodiazepines) were
6
gradually withdrawn. The EEG recording at 25 days of age still showed multifocal epileptiform activity
in sleep, with alternating trends [Figure 1C]. These abnormalities were attenuated during wake and were
associated with medium voltage monomorphic theta-delta rhythms with slow bifrontal graphoelements.
At age 1 month, the EEG revealed better-organized background activity and a reduction in the epileptic