
Page 43 - Read Online
P. 43
Page 42 Bennett. J Transl Genet Genom 2020;4:36-49 I https://doi.org/10.20517/jtgg.2020.17
A C
D
B
2
2
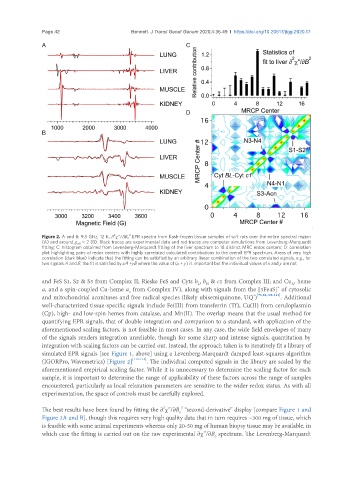
Figure 2. A and B: 9.5 GHz, 12 K, ∂ c”/∂B 0 EPR spectra from flash-frozen tissue samples of w/t rats over the entire spectral region
(A) and around g eff = 2 (B). Black traces are experimental data and red traces are computer simulations from Levenberg-Marquardt
fitting; C: histogram obtained from Levenberg-Marquardt fitting of the liver spectrum to 18 distinct MRC redox centers; D: correlation
plot highlighting pairs of redox centers with highly correlated calculated contributions to the overall EPR spectrum. Areas of very high
correlation (dark blue) indicate that the fitting can be satisfied by an arbitrary linear combination of the two correlated signals, e.g., for
two signals A and B, the fit is satisfied by xA +yB where the value of (x + y) is important but the individual values of x and y are not
and FeS S1, S2 & S3 from Complex II; Rieske FeS and Cyts b , b & c1 from Complex III; and Cu , heme
L
H
A
+
a, and a spin-coupled Cu-heme a from Complex IV), along with signals from the [3Fe4S] of cytosolic
3
• [79,82,108-111]
and mitochondrial aconitases and free radical species (likely ubisemiquinone, UQ ) . Additional
well-characterized tissue-specific signals include Fe(III) from transferrin (Tf), Cu(II) from ceruloplasmin
(Cp), high- and low-spin hemes from catalase, and Mn(II). The overlap means that the usual method for
quantifying EPR signals, that of double integration and comparison to a standard, with application of the
aforementioned scaling factors, is not feasible in most cases. In any case, the wide field envelopes of many
of the signals renders integration unreliable, though for some sharp and intense signals, quantitation by
integration with scaling factors can be carried out. Instead, the approach taken is to iteratively fit a library of
simulated EPR signals [see Figure 1, above] using a Levenberg-Marquardt damped least-squares algorithm
(IGORPro, Wavemetrics) [Figure 2] [112-114] . The individual computed signals in the library are scaled by the
aforementioned empirical scaling factor. While it is unnecessary to determine the scaling factor for each
sample, it is important to determine the range of applicability of these factors across the range of samples
encountered, particularly as local relaxation parameters are sensitive to the wider redox status. As with all
experimentation, the space of controls must be carefully explored.
2
2
The best results have been found by fitting the ∂ c”/∂B “second-derivative” display [compare Figure 1 and
0
Figure 2A and B], though this requires very high quality data that in turn requires ~300 mg of tissue, which
is feasible with some animal experiments whereas only 20-50 mg of human biopsy tissue may be available, in
which case the fitting is carried out on the raw experimental ∂c”/∂B spectrum. The Levenberg-Marquardt
0