
Page 40 - Read Online
P. 40
Bennett. J Transl Genet Genom 2020;4:36-49 I https://doi.org/10.20517/jtgg.2020.17 Page 39
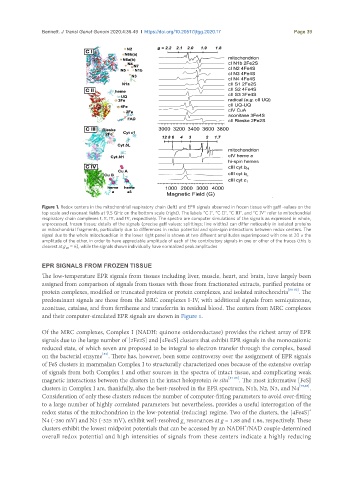
Figure 1. Redox centers in the mitochondrial respiratory chain (left) and EPR signals observed in frozen tissue with geff -values on the
top scale and resonant fields at 9.5 GHz on the bottom scale (right). The labels “C I”, “C II”, “C III”, and “C IV” refer to mitochondrial
respiratory chain complexes I, II, III, and IV, respectively. The spectra are computer simulations of the signals as expressed in whole,
unprocessed, frozen tissue; details of the signals (precise geff values; splittings; line widths) can differ noticeably in isolated proteins
or mitochondrial fragments, particularly due to differences in redox potential and spin-spin interactions between redox centers. The
signal due to the whole mitochondrion in the lower right panel is shown at two different amplitudes superimposed with one at 20 × the
amplitude of the other, in order to have appreciable amplitude of each of the contributory signals in one or other of the traces (this is
clearest at g eff = 6), while the signals shown individually have normalized peak amplitudes
EPR SIGNALS FROM FROZEN TISSUE
The low-temperature EPR signals from tissues including liver, muscle, heart, and brain, have largely been
assigned from comparison of signals from tissues with those from fractionated extracts, purified proteins or
protein complexes, modified or truncated proteins or protein complexes, and isolated mitochondria [80-82] . The
predominant signals are those from the MRC complexes I-IV, with additional signals from semiquinones,
aconitase, catalase, and from ferriheme and transferrin in residual blood. The centers from MRC complexes
and their computer-simulated EPR signals are shown in Figure 1.
Of the MRC complexes, Complex I (NADH: quinone oxidoreductase) provides the richest array of EPR
signals due to the large number of [2Fe2S] and [4Fe4S] clusters that exhibit EPR signals in the monocationic
reduced state, of which seven are proposed to be integral to electron transfer through the complex, based
[83]
on the bacterial enzyme . There has, however, been some controversy over the assignment of EPR signals
of FeS clusters in mammalian Complex I to structurally characterized ones because of the extensive overlap
of signals from both Complex I and other sources in the spectra of intact tissue, and complicating weak
magnetic interactions between the clusters in the intact holoprotein in situ [84-86] . The most informative [FeS]
clusters in Complex I are, thankfully, also the best-resolved in the EPR spectrum, N1b, N2, N3, and N4 [79,83] .
Consideration of only these clusters reduces the number of computer-fitting parameters to avoid over-fitting
to a large number of highly correlated parameters but nevertheless, provides a useful interrogation of the
+
redox status of the mitochondrion in the low-potential (reducing) regime. Two of the clusters, the [4Fe4S]
N4 (-280 mV) and N3 (-325 mV), exhibit well-resolved g resonances at g = 1.88 and 1.86, respectively. These
3
+
clusters exhibit the lowest midpoint potentials that can be accessed by an NADH /NAD couple-determined
overall redox potential and high intensities of signals from these centers indicate a highly reducing