
Page 67 - Read Online
P. 67
Fichera et al. J Transl Genet Genom 2020;4:114-32 I http://dx.doi.org/10.20517/jtgg.2020.16 Page 125
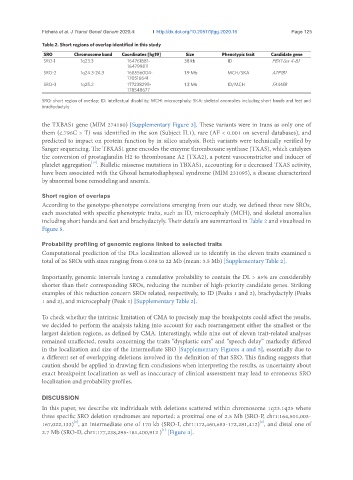
Table 2. Short regions of overlap identified in this study
SRO Chromosome band Coordinates [hg19] Size Phenotypic trait Candidate gene
SRO-1 1q23.3 164761881- 38 kb ID PBX1 (ex 4-8)
164799811
SRO-2 1q24.3-24.3 168556004- 1.9 Mb MCH/SKA ATP1B1
170516641
SRO-3 1q25.2 177238295- 1.3 Mb ID/MCH FAM5B
178548677
SRO: short region of overlap; ID: intellectual disability; MCH: microcephaly; SKA: skeletal anomalies including short hands and feet and
brachydactyly
the TXBAS1 gene (MIM 274180) [Supplementary Figure 3]. These variants were in trans as only one of
them (c.796C > T) was identified in the son (Subject II.1), rare (AF < 0.001 on several databases), and
predicted to impact on protein function by in silico analysis. Both variants were technically verified by
Sanger sequencing. The TBXAS1 gene encodes the enzyme thromboxane synthase (TXAS), which catalyzes
the conversion of prostaglandin H2 to thromboxane A2 (TXA2), a potent vasoconstrictor and inducer of
[14]
platelet aggregation . Biallelic missense mutations in TBXAS1, accounting for a decreased TXAS activity,
have been associated with the Ghosal hematodiaphyseal syndrome (MIM 231095), a disease characterized
by abnormal bone remodeling and anemia.
Short region of overlaps
According to the genotype-phenotype correlations emerging from our study, we defined three new SROs,
each associated with specific phenotypic traits, such as ID, microcephaly (MCH), and skeletal anomalies
including short hands and feet and brachydactyly. Their details are summarized in Table 2 and visualized in
Figure 5.
Probability profiling of genomic regions linked to selected traits
Computational prediction of the DLs localization allowed us to identify in the eleven traits examined a
total of 26 SROs with sizes ranging from 0.038 to 22 Mb (mean: 3.5 Mb) [Supplementary Table 2].
Importantly, genomic intervals having a cumulative probability to contain the DL > 85% are considerably
shorter than their corresponding SROs, reducing the number of high-priority candidate genes. Striking
examples of this reduction concern SROs related, respectively, to ID (Peaks 1 and 2), brachydactyly (Peaks
1 and 2), and microcephaly (Peak 1) [Supplementary Table 2].
To check whether the intrinsic limitation of CMA to precisely map the breakpoints could affect the results,
we decided to perform the analysis taking into account for each rearrangement either the smallest or the
largest deletion regions, as defined by CMA. Interestingly, while nine out of eleven trait-related analyses
remained unaffected, results concerning the traits “dysplastic ears” and “speech delay” markedly differed
in the localization and size of the intermediate SRO [Supplementary Figures 4 and 5], essentially due to
a different set of overlapping deletions involved in the definition of that SRO. This finding suggests that
caution should be applied in drawing firm conclusions when interpreting the results, as uncertainty about
exact breakpoint localization as well as inaccuracy of clinical assessment may lead to erroneous SRO
localization and probability profiles.
DISCUSSION
In this paper, we describe six individuals with deletions scattered within chromosome 1q23.1q25 where
three specific SRO deletion syndromes are reported: a proximal one of 2.5 Mb (SRO-P, chr1:164,501,003-
[2]
167,022,133) , an intermediate one of 170 kb (SRO-I, chr1:172,460,683-172,281,412) , and distal one of
[1]
[1]
2.7 Mb (SRO-D, chr1:177,238,295-181,400,912 ) [Figure 4].