
Page 35 - Read Online
P. 35
Page 399 Chandramohan et al. J Transl Genet Genom 2024;8:394-404 https://dx.doi.org/10.20517/jtgg.2024.38
Table 2. Baseline characteristics and kidney biopsy findings of female patients with Fabry disease at the time of kidney biopsy
Total
Affected Affected focal
No. SCr UPCR CKD EPI-eGFR 2 Lyso GL-3 glomerular glomerular points by Podocyte Effacement
(%)
(mg/dL) (g/g) (mL/min/1.73m ) (ng/mL)
scoring
inclusions
sclerosis (#) sclerosis (#)
system
1 0.6 0.33 106 < 5.0 N N 3 Y Suboptimal
2 0.8 0.06 81 5.1 N N 3 Y 30
3 0.7 0.04 93 < 5.0 2 N 2 Y > 50
4 1.2 0.51 56 < 5.0 N N 3 Y < 50
5 0.6 0.23 108 < 5.0 N N 2 Y 50
6 0.8 0.16 83 < 5.0 N N - Y 30-50
7 0.7 0.06 90 2.3* 1 N 2 Y 35
8 0.7 0.12 108 < 5.0 N N 2 Y 10
9 0.8 0.41 105 < 5.0 1 N - Y 10
10 0.8 0.12 79 5.1 N N 2.3 Y 50
11 0.5 0.16 130 NA N 1 2 Y < 50
12 0.8 < 0.08 100 < 5.0 N N 2 Y 75
13 0.7 0.26 130 < 5.0 N N - Y < 10
*detected using a newer assay, which was not available at the time of testing of the other patients. Abbreviations: SCr: Serum creatinine; UPCR:
Urine protein/creatinine ratio; CKD EPI-eGFR: Chronic kidney disease epidemiology collaboration estimated glomerular filtration rate; Lyso GL-3:
Globotriaosylsphingosine; Y: Yes; N: No; NA: Not available.
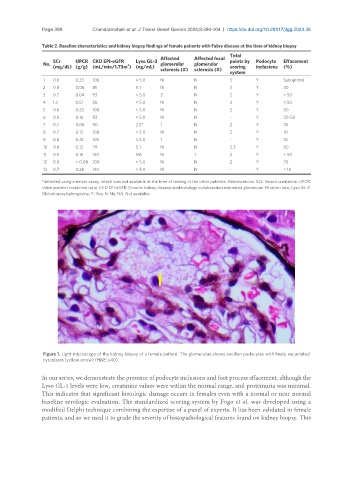
Figure 1. Light microscopy of the kidney biopsy of a female patient. The glomerulus shows swollen podocytes with finely vacuolated
cytoplasm (yellow arrow) (H&E; x40).
In our series, we demonstrate the presence of podocyte inclusions and foot process effacement, although the
Lyso GL-3 levels were low, creatinine values were within the normal range, and proteinuria was minimal.
This indicates that significant histologic damage occurs in females even with a normal or near normal
baseline serologic evaluation. The standardized scoring system by Fogo et al. was developed using a
modified Delphi technique combining the expertise of a panel of experts. It has been validated in female
patients, and so we used it to grade the severity of histopathological features found on kidney biopsy. This