
Page 19 - Read Online
P. 19
Page 290 Kenneson et al. J Transl Genet Genom 2024;8:285-97 https://dx.doi.org/10.20517/jtgg.2024.22
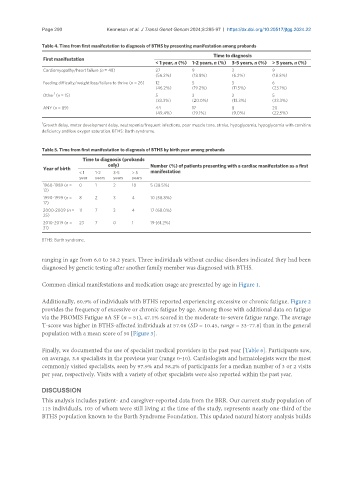
Table 4. Time from first manifestation to diagnosis of BTHS by presenting manifestation among probands
Time to diagnosis
First manifestation
< 1 year, n (%) 1-2 years, n (%) 3-5 years, n (%) > 5 years, n (%)
Cardiomyopathy/heart failure (n = 48) 27 9 3 9
(56.2%) (18.8%) (6.2%) (18.8%)
Feeding difficulty/weight loss/failure to thrive (n = 26) 12 5 3 6
(46.2%) (19.2%) (11.5%) (23.1%)
1
Other (n = 15) 5 3 2 5
(33.3%) (20.0%) (13.3%) (33.3%)
ANY (n = 89) 44 17 8 20
(49.4%) (19.1%) (9.0%) (22.5%)
1
Growth delay, motor development delay, neutropenia/frequent infections, poor muscle tone, stroke, hypoglycemia, hypoglycemia with carnitine
deficiency and low oxygen saturation. BTHS: Barth syndrome.
Table 5. Time from first manifestation to diagnosis of BTHS by birth year among probands
Time to diagnosis (probands
only) Number (%) of patients presenting with a cardiac manifestation as a first
Year of birth
< 1 1-2 3-5 > 5 manifestation
year years years years
1960-1989 (n = 0 1 2 10 5 (38.5%)
13)
1990-1999 (n = 8 2 3 4 10 (58.8%)
17)
2000-2009 (n = 11 7 3 4 17 (68.0%)
25)
2010-2019 (n = 23 7 0 1 19 (61.2%)
31)
BTHS: Barth syndrome.
ranging in age from 6.0 to 58.2 years. Three individuals without cardiac disorders indicated they had been
diagnosed by genetic testing after another family member was diagnosed with BTHS.
Common clinical manifestations and medication usage are presented by age in Figure 1.
Additionally, 60.9% of individuals with BTHS reported experiencing excessive or chronic fatigue. Figure 2
provides the frequency of excessive or chronic fatigue by age. Among those with additional data on fatigue
via the PROMIS Fatigue 8A SF (n = 51), 47.1% scored in the moderate-to-severe fatigue range. The average
T-score was higher in BTHS-affected individuals at 57.06 (SD = 10.45, range = 33-77.8) than in the general
population with a mean score of 50 [Figure 3].
Finally, we documented the use of specialist medical providers in the past year [Table 6]. Participants saw,
on average, 3.6 specialists in the previous year (range 0-10). Cardiologists and hematologists were the most
commonly visited specialists, seen by 97.9% and 58.2% of participants for a median number of 3 or 2 visits
per year, respectively. Visits with a variety of other specialists were also reported within the past year.
DISCUSSION
This analysis includes patient- and caregiver-reported data from the BRR. Our current study population of
115 individuals, 105 of whom were still living at the time of the study, represents nearly one-third of the
BTHS population known to the Barth Syndrome Foundation. This updated natural history analysis builds