
Page 18 - Read Online
P. 18
Kenneson et al. J Transl Genet Genom 2024;8:285-97 https://dx.doi.org/10.20517/jtgg.2024.22 Page 289
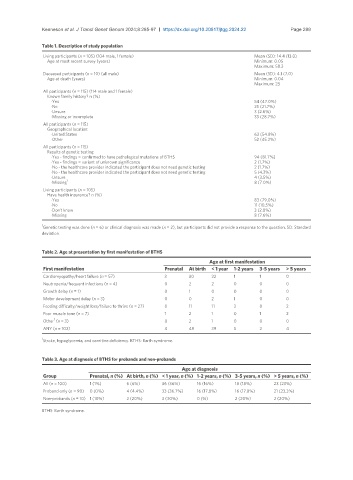
Table 1. Description of study population
Living participants (n = 105) (104 male, 1 female) Mean (SD): 14.4 (13.0)
Age at most recent survey (years) Minimum: 0.05
Maximum: 58.3
Deceased participants (n = 10) (all male) Mean (SD): 4.1 (7.0)
Age at death (years) Minimum: 0.04
Maximum: 23
All participants (n = 115) (114 male and 1 female)
Known family history? n (%)
·Yes 54 (47.0%)
·No 25 (21.7%)
·Unsure 3 (2.6%)
·Missing or incomplete 33 (28.7%)
All participants (n = 115)
Geographical location:
·United States 63 (54.8%)
·Other 52 (45.2%)
All participants (n = 115)
Results of genetic testing:
·Yes - findings = confirmed to have pathological mutations of BTHS 94 (81.7%)
·Yes - findings = variant of unknown significance 2 (1.7%)
·No - the healthcare provider indicated the participant does not need genetic testing 2 (1.7%)
·No - the healthcare provider indicated the participant does not need genetic testing 5 (4.3%)
·Unsure 4 (3.5%)
1
·Missing 8 (7.0%)
Living participants (n = 105)
Have health insurance? n (%)
·Yes 83 (79.0%)
·No 11 (10.5%)
·Don’t know 3 (2.8%)
·Missing 8 (7.6%)
1
Genetic testing was done (n = 6) or clinical diagnosis was made (n = 2), but participants did not provide a response to the question. SD: Standard
deviation.
Table 2. Age at presentation by first manifestation of BTHS
Age at first manifestation
First manifestation Prenatal At birth < 1 year 1-2 years 3-5 years > 5 years
Cardiomyopathy/heart failure (n = 57) 3 30 22 1 1 0
Neutropenia/frequent infections (n = 4) 0 2 2 0 0 0
Growth delay (n = 1) 0 1 0 0 0 0
Motor development delay (n = 3) 0 0 2 1 0 0
Feeding difficulty/weight loss/failure to thrive (n = 27) 0 11 11 3 0 2
Poor muscle tone (n = 7) 1 2 1 0 1 2
1
Other (n = 3) 0 2 1 0 0 0
ANY (n = 102) 4 48 39 5 2 4
1
Stroke, hypoglycemia, and carnitine deficiency. BTHS: Barth syndrome.
Table 3. Age at diagnosis of BTHS for probands and non-probands
Age at diagnosis
Group Prenatal, n (%) At birth, n (%) < 1 year, n (%) 1-2 years, n (%) 3-5 years, n (%) > 5 years, n (%)
All (n = 100) 1 (1%) 6 (6%) 36 (36%) 16 (16%) 18 (18%) 23 (23%)
Proband only (n = 90) 0 (0%) 4 (4.4%) 33 (36.7%) 16 (17.8%) 16 (17.8%) 21 (23.3%)
Non-probands (n = 10) 1 (10%) 2 (20%) 3 (30%) 0 (%) 2 (20%) 2 (20%)
BTHS: Barth syndrome.