
Page 89 - Read Online
P. 89
Page 14 of 45 Mooraj et al. J Mater Inf 2023;3:4 https://dx.doi.org/10.20517/jmi.2022.41
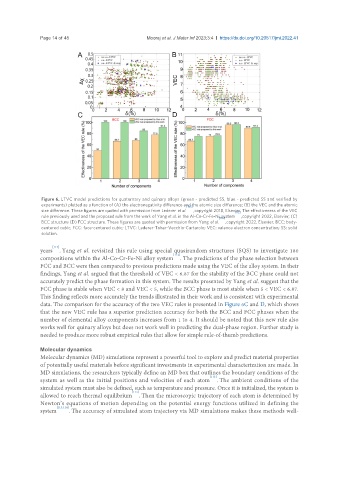
Figure 6. LTVC model predictions for quaternary and quinary alloys (green - predicted SS, blue - predicted SS and verified by
experiments) plotted as a function of (A) the electronegativity difference and the atomic size difference; (B) the VEC and the atomic
[105]
size difference. These figures are quoted with permission from Lederer et al. , copyright 2018, Elsevier. The effectiveness of the VEC
[112]
rule previously used and the proposed rule from the work of Yang et al. in the Al-Co-Cr-Fe-Ni system , copyright 2022, Elsevier; (C)
[112]
BCC structure (D) FCC structure. These figures are quoted with permission from Yang et al. , copyright 2022, Elsevier. BCC: body-
centered cubic; FCC: face-centered cubic; LTVC: Lederer-Toher-Vecchio-Curtarolo; VEC: valence electron concentration; SS: solid
solution.
[112]
years . Yang et al. revisited this rule using special quasirandom structures (SQS) to investigate 180
[112]
compositions within the Al-Co-Cr-Fe-Ni alloy system . The predictions of the phase selection between
FCC and BCC were then compared to previous predictions made using the VEC of the alloy system. In their
findings, Yang et al. argued that the threshold of VEC < 6.87 for the stability of the BCC phase could not
accurately predict the phase formation in this system. The results presented by Yang et al. suggest that the
FCC phase is stable when VEC < 8 and VEC < 5, while the BCC phase is most stable when 5 < VEC < 6.87.
This finding reflects more accurately the trends illustrated in their work and is consistent with experimental
data. The comparison for the accuracy of the two VEC rules is presented in Figure 6C and D, which shows
that the new VEC rule has a superior prediction accuracy for both the BCC and FCC phases when the
number of elemental alloy components increases from 1 to 4. It should be noted that this new rule also
works well for quinary alloys but does not work well in predicting the dual-phase region. Further study is
needed to produce more robust empirical rules that allow for simple rule-of-thumb predictions.
Molecular dynamics
Molecular dynamics (MD) simulations represent a powerful tool to explore and predict material properties
of potentially useful materials before significant investments in experimental characterization are made. In
MD simulations, the researchers typically define an MD box that outlines the boundary conditions of the
[113]
system as well as the initial positions and velocities of each atom . The ambient conditions of the
simulated system must also be defined, such as temperature and pressure. Once it is initialized, the system is
[113]
allowed to reach thermal equilibrium . Then the microscopic trajectory of each atom is determined by
Newton’s equations of motion depending on the potential energy functions utilized in defining the
system [113,114] . The accuracy of simulated atom trajectory via MD simulations makes these methods well-