
Page 63 - Read Online
P. 63
Page 10 of 14 Liu et al. J Cancer Metastasis Treat 2019;5:4 I http://dx.doi.org/10.20517/2394-4722.2018.55
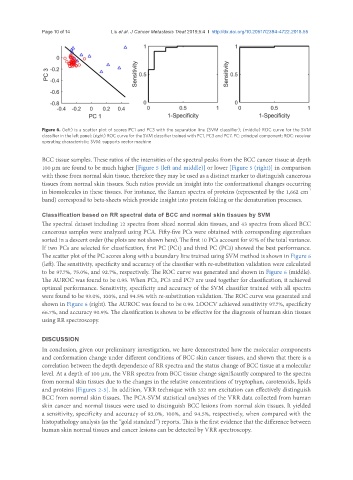
Figure 6. (left) is a scatter plot of scores PC1 and PC3 with the separation line (SVM classifier); (middle) ROC curve for the SVM
classifier in the left panel; (right) ROC curve for the SVM classifier trained with PC1, PC3 and PC7. PC: principal component; ROC: receiver
operating characteristic; SVM: supports vector machine
BCC tissue samples. These ratios of the intensities of the spectral peaks from the BCC cancer tissue at depth
100 µm are found to be much higher [Figure 5 (left and middle)] or lower [Figure 5 (right)] in comparison
with those from normal skin tissue, therefore they may be used as a distinct marker to distinguish cancerous
tissues from normal skin tissues. Such ratios provide an insight into the conformational changes occurring
-1
in biomolecules in these tissues. For instance, the Raman spectra of proteins (represented by the 1,662 cm
band) correspond to beta-sheets which provide insight into protein folding or the denaturation processes.
Classification based on RR spectral data of BCC and normal skin tissues by SVM
The spectral dataset including 12 spectra from sliced normal skin tissues, and 43 spectra from sliced BCC
cancerous samples were analyzed using PCA. Fifty-five PCs were obtained with corresponding eigenvalues
sorted in a descent order (the plots are not shown here). The first 10 PCs account for 97% of the total variance.
If two PCs are selected for classification, first PC (PC1) and third PC (PC3) showed the best performance.
The scatter plot of the PC scores along with a boundary line trained using SVM method is shown in Figure 6
(left). The sensitivity, specificity and accuracy of the classifier with re-substitution validation were calculated
to be 97.7%, 75.0%, and 92.7%, respectively. The ROC curve was generated and shown in Figure 6 (middle).
The AUROC was found to be 0.95. When PC1, PC3 and PC7 are used together for classification, it achieved
optimal performance. Sensitivity, specificity and accuracy of the SVM classifier trained with all spectra
were found to be 93.0%, 100%, and 94.5% with re-substitution validation. The ROC curve was generated and
shown in Figure 6 (right). The AUROC was found to be 0.99. LOOCV achieved sensitivity 97.7%, specificity
66.7%, and accuracy 90.9%. The classification is shown to be effective for the diagnosis of human skin tissues
using RR spectroscopy.
DISCUSSION
In conclusion, given our preliminary investigation, we have demonstrated how the molecular components
and conformation change under different conditions of BCC skin cancer tissues, and shown that there is a
correlation between the depth dependence of RR spectra and the status change of BCC tissue at a molecular
level. At a depth of 100 µm, the VRR spectra from BCC tissue change significantly compared to the spectra
from normal skin tissues due to the changes in the relative concentrations of tryptophan, carotenoids, lipids
and proteins [Figures 2-5]. In addition, VRR technique with 532 nm excitation can effectively distinguish
BCC from normal skin tissues. The PCA-SVM statistical analyses of the VRR data collected from human
skin cancer and normal tissues were used to distinguish BCC lesions from normal skin tissues. It yielded
a sensitivity, specificity and accuracy of 93.0%, 100%, and 94.5%, respectively, when compared with the
histopathology analysis (as the “gold standard”) reports. This is the first evidence that the difference between
human skin normal tissues and cancer lesions can be detected by VRR spectroscopy.