
Page 17 - Read Online
P. 17
Potdar et al. Circulating tumor cells in liquid biopsies
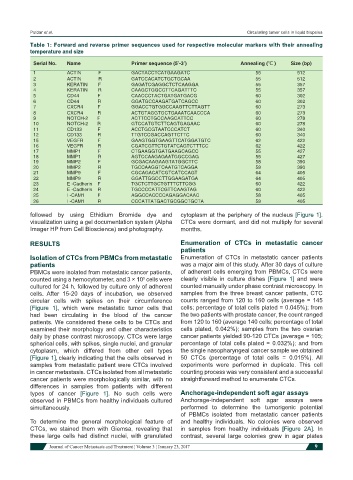
Table 1: Forward and reverse primer sequences used for respective molecular markers with their annealing
temperature and size
Serial No. Name Primer sequence (5’-3’) Annealing (℃ ) Size (bp)
1 ACTIN F GACTACCTCATGAAGATC 55 512
2 ACTIN R GATCCACATCTGCTGCAA 55 512
3 KERATIN F GAGATCGAGGCTCTCAAGGA 55 357
4 KERATIN R CAAGCTGGCCTTCAGATTTC 55 357
5 CD44 F CAACCCTACTGATGATGACG 60 302
6 CD44 R GGATGCCAAGATGATCAGCC 60 302
7 CXCR4 F GGACCTGTGGCCAAGTTCTTAGTT 60 273
8 CXCR4 R ACTGTAGGTGCTGAAATCAACCCA 60 273
9 NOTCH-2 F ACTTCCTGCCAAGCATTCC 60 278
10 NOTCH-2 R GTCCATGTCTTCAGTGAGAAC 60 278
11 CD133 F ACCTGCGTAATCCCATCT 60 340
12 CD133 R TTGTCCGACCAGTTCTTC 60 340
15 VEGFR F GAAGTGGTGAAGTTCATGGATGTC 62 422
16 VEGFR R CGATCGTTCTGTATCAGTCTTTCC 62 422
17 MMP1 F CTGAAGGTGATGAAGCAGCC 55 427
18 MMP1 R AGTCCAAGAGAATGGCCGAG 55 427
19 MMP2 F GCGACAAGAAGTATGGCTTC 58 390
20 MMP2 R TGCCAAGGTCAATGTCAGGA 58 390
21 MMP9 F CGCAGACATCGTCATCCAGT 64 405
22 MMP9 R GGATTGGCCTTGGAAGATGA 64 405
23 E -Cadherin F TGCTCTTGCTGTTTCTTCGG 60 422
24 E -Cadherin R TGCCCCATTCGTTCAAGTAG 60 422
25 I -CAM1 F AGGCCACCCCAGAGGACAAC 58 405
26 I -CAM1 R CCCATTATGACTGCGGCTGCTA 58 405
followed by using Ethidium Bromide dye and cytoplasm at the periphery of the nucleus [Figure 1].
visualization using a gel documentation system (Alpha CTCs were dormant, and did not multiply for several
Imager HP from Cell Bioscience) and photography. months.
RESULTS Enumeration of CTCs in metastatic cancer
patients
Isolation of CTCs from PBMCs from metastatic Enumeration of CTCs in metastatic cancer patients
patients was a major aim of this study. After 30 days of culture
PBMCs were isolated from metastatic cancer patients, of adherent cells emerging from PBMCs, CTCs were
counted using a hemocytometer, and 3 × 10 cells were clearly visible in culture dishes [Figure 1] and were
5
cultured for 24 h, followed by culture only of adherent counted manually under phase contrast microscopy. In
cells. After 15-20 days of incubation, we observed samples from the three breast cancer patients, CTC
circular cells with spikes on their circumference counts ranged from 120 to 160 cells (average = 145
[Figure 1], which were metastatic tumor cells that cells; percentage of total cells plated = 0.045%); from
had been circulating in the blood of the cancer the two patients with prostate cancer, the count ranged
patients. We considered these cells to be CTCs and from 120 to 160 (average 140 cells; percentage of total
examined their morphology and other characteristics cells plated, 0.042%); samples from the two ovarian
daily by phase contrast microscopy. CTCs were large cancer patients yielded 90-120 CTCs (average = 105;
spherical cells, with spikes, single nuclei, and granular percentage of total cells plated = 0.032%); and from
cytoplasm, which differed from other cell types the single nasopharyngeal cancer sample we obtained
[Figure 1], clearly indicating that the cells observed in 50 CTCs (percentage of total cells = 0.015%). All
samples from metastatic patient were CTCs involved experiments were performed in duplicate. This cell
in cancer metastasis. CTCs isolated from all metastatic counting process was very consistent and a successful
cancer patients were morphologically similar, with no straightforward method to enumerate CTCs.
differences in samples from patients with different
types of cancer [Figure 1]. No such cells were Anchorage-independent soft agar assays
observed in PBMCs from healthy individuals cultured Anchorage-independent soft agar assays were
simultaneously. performed to determine the tumorigenic potential
of PBMCs isolated from metastatic cancer patients
To determine the general morphological feature of and healthy individuals. No colonies were observed
CTCs, we stained them with Giemsa, revealing that in samples from healthy individuals [Figure 2A]. In
these large cells had distinct nuclei, with granulated contrast, several large colonies grew in agar plates
Journal of Cancer Metastasis and Treatment ¦ Volume 3 ¦ January 23, 2017 9