
Page 393 - Read Online
P. 393
Gironés et al. Age-related efficacy of treatment in metastatic NSCLC
Table 3: Multivariate analyses
Young (162) Elders (160) P
Age 9.4 (8.0-10.7) 8.4 (6.9-10.00) 0.238
Male N: 139: SG 8-8 (7.4-10.2) N: 142. SG: 7.9 (6.4-9.4) 0.263
Female N: 23. SG: 12.8 (8.8-16.9) N: 18. SG: 12 (6.7-17.3)
P = 0.069 P = 0.014
PS 0-1 N: 136 SG: 10.7 (9.2-12.2) N: 98. SG: 12.3 (10.2-14.5) 0.259
PS 2 N: 26. SG: 2.5 (1.3-3.7) N: 62. SG: 2.3 (1.9-2.7)
P = 0.0001 P = 0.0001
Never smoker N: 13. SG: 15.7 (10.4-21.1) N: 28. SG: 13.3 (8-18.7) 0.098
Smoker N: 112. SG: 8.7 (7.2-10.2) N: 33. SG: 5.4 (3.5-7.3)
Ex-smoker N: 37. SG: 8.8 (6.1-11.5) P = 0.041 N: 99. SG: 8.2 (6.4-10) P = 0.001
EGFR unknown N: 25. SG: 9.9 (6.8-12.9) N: 33. SG: 8.1 (5.6-10.6) 0.112
EGFR mutated N: 12. SG: 21.0 (13.7-28.3) N: 17. SG: 16.8 (10.2-23.3)
EGFR wild type N: 125. SG: 8.1 (6.8-9.4) P = 0.002 N: 110. SG: 7.3 (10.2-23.3) P = 0.0001
Squamous N: 55. SG: 7.6 (5.8-9.3) N: 70.SG: 7.5 (5.6-9.4) 0.612
Adenocarcinoma N: 88. SG: 10.9 (8.8-13) N: 59. SG: 10.1 (7.1-13.1) P = 0.002
P = 0.018
Treated N: 139. SG: 10.5 (9-12) N: 102. SG: 11.8 (9.7-13.9) 0.19
No treated N: 23. SG: 2.5 (1.1-3.8) N: 57. SG: 2.5 (2-3) P = 0.00001
P = 0.00001
Chemotherapy N: 117. SG: 18.0 (11.9-24) N: 71. SG:10.6 (8.5-12.8) 0.365
Radiotherapy N: 8. SG: 3.0 (1.89-4.1)) N: 13. SG: 3.6 (2.4-4.7)
EGFR TKI N: 13. SG:19.7 (12.5-26.9) N: 18. SG: 17.8 (11.4-24.2) P = 0.0001
P = 0.0001
Combined chemotherapy N: 89. SG: 9.2 (8.2-13.1) N: 48. SG: 10.7 (8.2-13.1)
Monotherapy N: 8. SG: 5.4 (3.3-7.4) N: 21. SG: 10.1 (6.3-13.9)
Bevacizumab N: 21. SG: 14.5 (10.3-18.6) P = 0.024 N: 2 SG: 19.0 (12-42) P = 0.248
EGFR: epidermal growth factor receptor; TKI: tyrosine kinase inhibitor; PS: performance status; SG: study group
For female patients, never smoking and adenocarcinoma months in the elderly group, P = 0.000) [Figures 3
histology were related to EGFR-mutation and EGFR- and 4]. For those patients suitable for treatment (PS
TKI; only EGFR-mutation remained significant in 0-1), radiotherapy, chemotherapy and EGFR treatment
multivariate analysis for overall survival [Table 3]. when appropriate were also found to provide benefits
[Figure 5]. No impact on overall survival was found
When we excluded these confounding factors, PS with respect to treatment for patients with a PS of 2 (3
0-1 and systemic chemotherapy were independently vs. 2.6 vs. 2.3 months; radiotherapy vs. chemotherapy
associated with better survival in both groups. vs. EGFR treatment respectively).
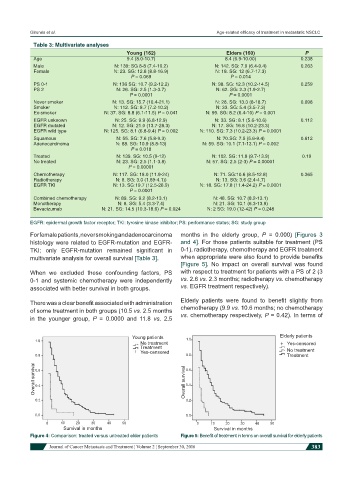
There was a clear benefit associated with administration Elderly patients were found to benefit slightly from
of some treatment in both groups (10.5 vs. 2.5 months chemotherapy (9.9 vs. 10.6 months; no chemotherapy
in the younger group, P = 0.0000 and 11.8 vs. 2.5 vs. chemotherapy respectively, P = 0.42). In terms of
Young patients Elderly patients
1.0 No treatment 1.0 Yes-censored
Treatment
Yes-censored No treatment
0.8 0.8 Treatment
Overall survival 0.6 Overall survival 0.6
0.4
0.4
0.2 0.2
0.0 0.0
0 10 20 30 40 50 0 10 20 30 40 50
Survival in months Survival in months
Figure 4: Comparison: treated versus untreated elder patients Figure 5: Benefit of treatment in terms on overall survival for elderly patients
Journal of Cancer Metastasis and Treatment ¦ Volume 2 ¦ September 30, 2016 383