
Page 26 - Read Online
P. 26
Page 6 of 13 Quartuccio et al. J Cancer Metastasis Treat 2021;7:14 I http://dx.doi.org/10.20517/2394-4722.2020.118
Figure 2. QUADAS-2 results.
A B
18
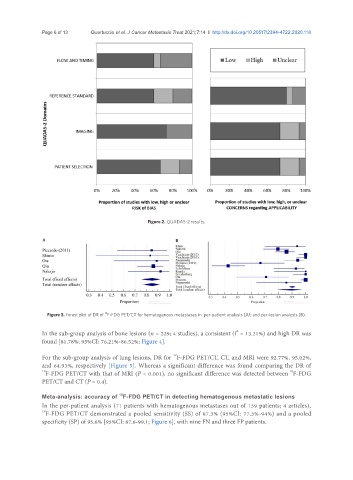
Figure 3. Forest plot of DR of F-FDG PET/CT for hematogenous metastases in: per-patient analysis (A); and per-lesion analysis (B).
In the sub-group analysis of bone lesions (n = 229; 4 studies), a consistent (I = 13.21%) and high DR was
2
found [81.78%; 95%CI: 76.21%-86.52%; Figure 4].
18
For the sub-group analysis of lung lesions, DR for F-FDG PET/CT, CT, and MRI were 92.77%, 95.02%,
and 64.93%, respectively [Figure 5]. Whereas a significant difference was found comparing the DR of
18 F-FDG PET/CT with that of MRI (P < 0.001), no significant difference was detected between F-FDG
18
PET/CT and CT (P = 0.4).
18
Meta-analysis: accuracy of F-FDG PET/CT in detecting hematogenous metastatic lesions
In the per-patient analysis (71 patients with hematogenous metastases out of 139 patients; 4 articles),
18 F-FDG PET/CT demonstrated a pooled sensitivity (SS) of 87.3% (95%CI: 77.3%-94%) and a pooled
specificity (SP) of 95.6% [95%CI: 87.6-99.1; Figure 6], with nine FN and three FP patients.