
Page 9 - Read Online
P. 9
Baker et al. J Cancer Metastasis Treat 2020;6:24 I http://dx.doi.org/10.20517/2394-4722.2020.36 Page 5 of 12
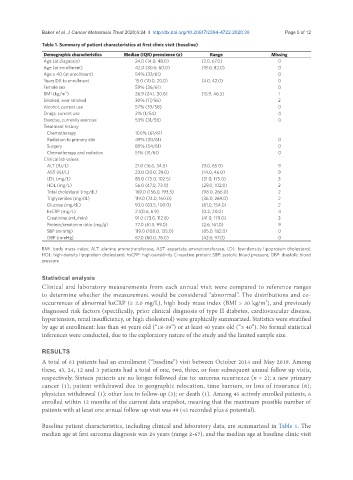
Table 1. Summary of patient characteristics at first clinic visit (baseline)
Demographic characteristics Median (IQR) prevalence (n) Range Missing
Age (at diagnosis) 24.0 (14.0, 48.0) (2.0, 67.0) 0
Age (at enrollment) 42.0 (30.0, 60.0) (18.0, 82.0) 0
Age ≥ 40 (at enrollment) 54% (33/61) 0
Years DX to enrollment 15.0 (10.0, 20.0) (4.0, 42.0) 0
Female sex 59% (36/61) 0
2
BMI (kg/m ) 26.9 (24.1, 30.8) (15.9, 46.5) 1
Smoked, ever smoked 30% (17/56) 2
Alcohol, current use 57% (33/58) 0
Drugs, current use 2% (1/54) 4
Exercise, currently exercise 53% (31/58) 0
Treatment history
Chemotherapy 100% (61/61)
Radiation to primary site 49% (30/61) 0
Surgery 89% (54/61) 0
Chemotherapy and radiation 51% (31/61) 0
Clinical lab values
ALT (IU/L) 21.0 (16.0, 34.5) (9.0, 65.0) 9
AST (IU/L) 23.0 (20.0, 29.0) (14.0, 46.0) 9
LDL (mg/L) 85.0 (75.0, 102.5) (31.0, 175.0) 3
HDL (mg/L) 56.0 (47.0, 73.0) (29.0, 102.0) 2
Total cholesterol (mg/dL) 169.0 (156.0, 193.5) (98.0, 266.0) 2
Triglycerides (mg/dL) 119.0 (74.0, 160.0) (36.0, 269.0) 2
Glucose (mg/dL) 93.0 (83.5, 100.0) (61.0, 154.0) 2
hsCRP (mg/L) 2.1(0.6, 6.9) (0.2, 20.0) 4
Creatinine (mL/min) 91.0 (73.0, 112.8) (41.0, 179.0) 3
Protein/creatinine ratio (mg/g) 77.0 (61.5, 99.0) (2.6, 161.0) 9
SBP (mmHg) 119.0 (108.0, 135.0) (85.0, 182.0) 0
DBP (mmHg) 67.0 (60.0, 76.0) (42.0, 97.0) 0
BMI: body mass index; ALT: alanine aminotransferase; AST: aspartate aminotransferase; LDL: low-density lipoprotein cholesterol;
HDL: high-density lipoprotein cholesterol; hsCRP: high-sensitivity C-reactive protein; SBP: systolic blood pressure; DBP: diastolic blood
pressure
Statistical analysis
Clinical and laboratory measurements from each annual visit were compared to reference ranges
to determine whether the measurement would be considered “abnormal”. The distributions and co-
2
occurrences of abnormal hsCRP (≥ 2.0 mg/L), high body mass index (BMI > 30 kg/m ), and previously
diagnosed risk factors (specifically, prior clinical diagnosis of type II diabetes, cardiovascular disease,
hypertension, renal insufficiency, or high cholesterol) were graphically summarized. Statistics were stratified
by age at enrollment: less than 40 years old (“18-39”) or at least 40 years old (“≥ 40”). No formal statistical
inferences were conducted, due to the exploratory nature of the study and the limited sample size.
RESULTS
A total of 61 patients had an enrollment (“baseline”) visit between October 2014 and May 2019. Among
these, 43, 24, 12 and 3 patients had a total of one, two, three, or four subsequent annual follow up visits,
respectively. Sixteen patients are no longer followed due to: sarcoma recurrence (n = 2); a new primary
cancer (1); patient withdrawal due to geographic relocation, time barriers, or loss of insurance (8);
physician withdrawal (1); other loss to follow-up (3); or death (1). Among 45 actively enrolled patients, 6
enrolled within 12 months of the current data snapshot, meaning that the maximum possible number of
patients with at least one annual follow-up visit was 49 (43 recorded plus 6 potential).
Baseline patient characteristics, including clinical and laboratory data, are summarized in Table 1. The
median age at first sarcoma diagnosis was 24 years (range 2-67), and the median age at baseline clinic visit