
Page 82 - Read Online
P. 82
Huang et al. J Cancer Metastasis Treat 2019;5:34 I http://dx.doi.org/10.20517/2394-4722.2018.94 Page 9 of 18
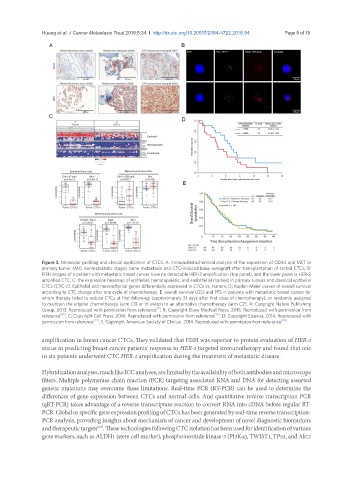
Figure 3. Molecular profiling and clinical application of CTCs. A: Immunohistochemical analysis of the expression of CD44 and MET in
primary tumor (M0, nonmetastatic stage), bone metastasis and CTC-induced bone xenograft after transplantation of sorted CTCs; B:
FISH images of a patient with metastatic breast cancer have no detectable HER-2 amplification (top panel), and the lower panel is HER-2
amplified CTC; C: the expression heatmap of epithelial, hematopoietic, and endothelial markers in primary tumors and classical epithelial
CTCs (CTC-c). Epithelial and mesenchymal genes differentially expressed in CTCs vs. tumors; D: Kaplan-Meier curves of overall survival
according to CTC change after one cycle of chemotherapy; E: overall survival (OS) and PFS in patients with metastatic breast cancer for
whom therapy failed to reduce CTCs at first follow-up (approximately 21 days after first dose of chemotherapy), or randomly assigned
to maintain the original chemotherapy (arm C1) or to switch to an alternative chemotherapy (arm C2). A: Copyright Nature Publishing
[4]
Group, 2013. Reproduced with permission from reference ; B: Copyright Dove Medical Press, 2016. Reproduced with permission from
reference [67] ; C: Copyright Cell Press, 2014. Reproduced with permission from reference [75] ; D: Copyright Elsevier, 2014. Reproduced with
permission from reference [79] ; E: Copyright American Society of Clinical, 2014. Reproduced with permission from reference [80]
amplification in breast cancer CTCs. They validated that FISH was superior to protein evaluation of HER-2
status in predicting breast cancer patients' response to HER-2 targeted immunotherapy and found that one
in six patients underwent CTC HER-2 amplification during the treatment of metastatic disease.
Hybridization analyses, much like ICC analyses, are limited by the availability of both antibodies and microscope
filters. Multiple polymerase chain reaction (PCR) targeting associated RNA and DNA for detecting assorted
genetic mutations may overcome these limitations. Real-time PCR (RT-PCR) can be used to determine the
differences of gene expression between CTCs and normal cells. And quantitative reverse transcription PCR
(qRT-PCR) takes advantage of a reverse transcriptase reaction to convert RNA into cDNA before regular RT-
PCR. Global or specific gene expression profiling of CTCs has been generated by real-time reverse transcription-
PCR analysis, providing insights about mechanism of cancer and development of novel diagnostic biomarkers
and therapeutic targets . These technologies following CTC isolation has been used for identification of various
[68]
gene markers, such as ALDH1 (stem cell marker), phosphoinositide kinase-3 (PI3Kα), TWIST1, TP53, and Akt2