
Page 90 - Read Online
P. 90
Page 396 Wang et al. Intell Robot 2022;2(4):391-406 https://dx.doi.org/10.20517/ir.2022.25
neural network for concrete structural crack damage classification, where the multilevel cascade classifier
was utilized to extract the characteristics of concrete cracks and achieved an accuracy of 97.9% . Zheng et
[15]
al. adopted a model based on a CNN to amplify and extract the features for 5000 concrete crack images and
analyzed the morphological and geometric indices of cracks through the training of building surface data
such as roads, bridges, houses and dams, while achieving the highest crack detection accuracy of 98% and
the average detection accuracy of 87% . Xu et al. proposed an end-to-end crack detection model based on
[46]
a CNN for 2068 bridge crack images using only images and image labels as input and extracted multiscale
crack feature information by using cavity convolution and pooling methods, thus reducing the
computational complexity and achieving a high recognition rate (96.37%) . Teng et al. applied 11 well-
[47]
known CNN models as the feature extractor of YOLOv2 for crack detection with 990 RGB bridge crack
images, providing a basis for rapid and accurate crack detection of concrete structures, and achieved a high
precision of 0.89 and a fast computing speed .
[48]
The self-attention mechanism is a model in deep learning that has been widely applied in natural language
processing tasks in recent years. The idea of attention is to filter out a small amount of important
information from a large amount of information and focus on this important information, disregarding
most of the unimportant information. The larger the weight, the more focused the corresponding feature,
where the weight represents the importance of the feature. The self-attention mechanism reduces the
dependence on external information and is better at capturing the internal correlations of data or features.
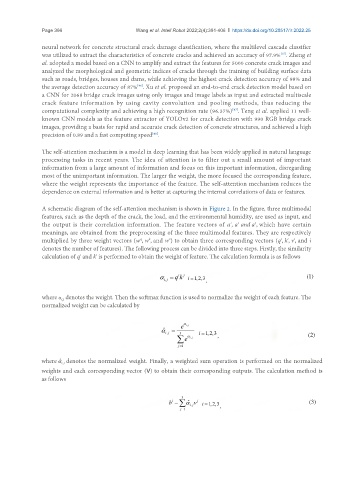
A schematic diagram of the self-attention mechanism is shown in Figure 2. In the figure, three multimodal
features, such as the depth of the crack, the load, and the environmental humidity, are used as input, and
the output is their correlation information. The feature vectors of a , a and a , which have certain
3
2
1
meanings, are obtained from the preprocessing of the three multimodal features. They are respectively
multiplied by three weight vectors (w , w , and w ) to obtain three corresponding vectors (q, k, v, and i
v
k
i
i
i
q
denotes the number of features). The following process can be divided into three steps. Firstly, the similarity
calculation of q and k is performed to obtain the weight of feature. The calculation formula is as follows
i
i
(1)
where α denotes the weight. Then the softmax function is used to normalize the weight of each feature. The
i,j
normalized weight can be calculated by
(2)
where denotes the normalized weight. Finally, a weighted sum operation is performed on the normalized
i
weights and each corresponding vector (v) to obtain their corresponding outputs. The calculation method is
as follows
(3)