
Page 11 - Read Online
P. 11
Wu et al. Intell Robot 2022;2(2):10529 I http://dx.doi.org/10.20517/ir.2021.20 Page 109
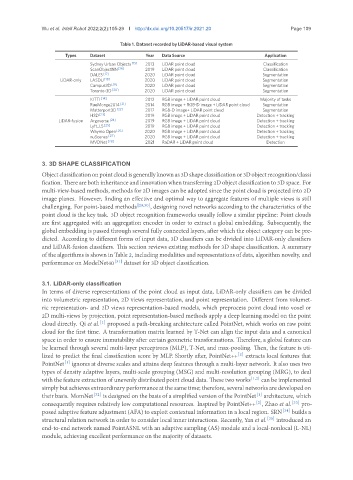
Table 1. Dataset recorded by LiDAR-based visual system
Types Dataset Year Data Source Application
Sydney Urban Objects [15] 2013 LiDAR point cloud Classification
ScanObjectNN [16] 2019 LiDAR point cloud Classification
DALES [17] 2020 LiDAR point cloud Segmentation
LiDAR-only LASDU [18] 2020 LiDAR point cloud Segmentation
Campus3D [19] 2020 LiDAR point cloud Segmentation
Toronto-3D [20] 2020 LiDAR point cloud Segmentation
KITTI [14] 2012 RGB image + LiDAR point cloud Majority of tasks
RueMonge2014 [21] 2014 RGB image + RGB-D image + LiDAR point cloud Segmentation
Matterport3D [22] 2017 RGB-D image+ LiDAR point cloud Segmentation
H3D [23] 2019 RGB image + LiDAR point cloud Detection + tracking
LiDAR-fusion Argoverse [24] 2019 RGB image + LiDAR point cloud Detection + tracking
Lyft_L5 [25] 2019 RGB image + LiDAR point cloud Detection + tracking
Waymo Open [26] 2020 RGB image + LiDAR point cloud Detection + tracking
nuScenes [27] 2020 RGB image + LiDAR point cloud Detection + tracking
MVDNet [28] 2021 RaDAR + LiDAR point cloud Detection
3. 3D SHAPE CLASSIFICATION
Objectclassificationonpointcloudisgenerallyknownas3Dshapeclassificationor3Dobjectrecognition/classi
fication. There are both inheritance and innovation when transferring 2D object classification to 3D space. For
multi-view-based methods, methods for 2D images can be adopted since the point cloud is projected into 2D
image planes. However, finding an effective and optimal way to aggregate features of multiple views is still
challenging. For point-based methods [29,30] , designing novel networks according to the characteristics of the
point cloud is the key task. 3D object recognition frameworks usually follow a similar pipeline: Point clouds
are first aggregated with an aggregation encoder in order to extract a global embedding. Subsequently, the
global embedding is passed through several fully connected layers, after which the object category can be pre-
dicted. According to different forms of input data, 3D classifiers can be divided into LiDAR-only classifiers
and LiDAR-fusion classifiers. This section reviews existing methods for 3D shape classification. A summary
of the algorithms is shown in Table 2, including modalities and representations of data, algorithm novelty, and
performance on ModelNet40 [31] dataset for 3D object classification.
3.1. LiDARonly classification
In terms of diverse representations of the point cloud as input data, LiDAR-only classifiers can be divided
into volumetric representation, 2D views representation, and point representation. Different from volumet-
ric representation- and 2D views representation-based models, which preprocess point cloud into voxel or
2D multi-views by projection, point representation-based methods apply a deep learning model on the point
cloud directly. Qi et al. [1] proposed a path-breaking architecture called PointNet, which works on raw point
cloud for the first time. A transformation matrix learned by T-Net can align the input data and a canonical
space in order to ensure immutability after certain geometric transformations. Therefore, a global feature can
be learned through several multi-layer perceptrons (MLP), T-Net, and max-pooling. Then, the feature is uti-
lized to predict the final classification score by MLP. Shortly after, PointNet++ [2] extracts local features that
PointNet [1] ignores at diverse scales and attains deep features through a multi-layer network. It also uses two
types of density adaptive layers, multi-scale grouping (MSG) and multi-resolution grouping (MRG), to deal
with the feature extraction of unevenly distributed point cloud data. These two works [1,2] can be implemented
simply but achieves extraordinary performance at the same time; therefore, several networks are developed on
their basis. MomNet [32] is designed on the basis of a simplified version of the PointNet [1] architecture, which
[2]
consequently requires relatively low computational resources. Inspired by PointNet++ , Zhao et al. [33] pro-
posed adaptive feature adjustment (AFA) to exploit contextual information in a local region. SRN [34] builds a
structural relation network in order to consider local inner interactions. Recently, Yan et al. [35] introduced an
end-to-end network named PointASNL with an adaptive sampling (AS) module and a local-nonlocal (L-NL)
module, achieving excellent performance on the majority of datasets.