
Page 132 - Read Online
P. 132
Boin et al. Intell Robot 2022;2(2):14567 I http://dx.doi.org/10.20517/ir.2022.11 Page 157
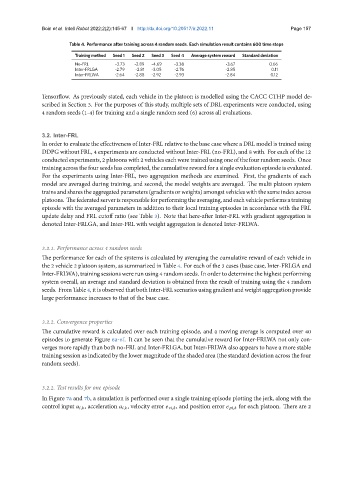
Table 4. Performance after training across 4 random seeds. Each simulation result contains 600 time steps
Training method Seed 1 Seed 2 Seed 3 Seed 4 Average system reward Standard deviation
No-FRL -3.73 -2.89 -4.69 -3.38 -3.67 0.66
Inter-FRLGA -2.79 -2.81 -3.05 -2.76 -2.85 0.11
Inter-FRLWA -2.64 -2.88 -2.92 -2.93 -2.84 0.12
Tensorflow. As previously stated, each vehicle in the platoon is modelled using the CACC CTHP model de-
scribed in Section 3. For the purposes of this study, multiple sets of DRL experiments were conducted, using
4 random seeds (1-4) for training and a single random seed (6) across all evaluations.
3.2. InterFRL
In order to evaluate the effectiveness of Inter-FRL relative to the base case where a DRL model is trained using
DDPG without FRL, 4 experiments are conducted without Inter-FRL (no-FRL), and 8 with. For each of the 12
conductedexperiments, 2platoonswith2vehicleseachweretrainedusingoneofthefourrandomseeds. Once
training acrossthe fourseeds hascompleted, the cumulative reward for a single evaluation episode is evaluated.
For the experiments using Inter-FRL, two aggregation methods are examined. First, the gradients of each
model are averaged during training, and second, the model weights are averaged. The multi platoon system
trainsandsharestheaggregatedparameters(gradientsorweights)amongstvehicleswiththesameindexacross
platoons. Thefederatedserverisresponsibleforperformingtheaveraging,andeachvehicleperformsatraining
episode with the averaged parameters in addition to their local training episodes in accordance with the FRL
update delay and FRL cutoff ratio (see Table 3). Note that here-after Inter-FRL with gradient aggregation is
denoted Inter-FRLGA, and Inter-FRL with weight aggregation is denoted Inter-FRLWA.
3.2.1. Performance across 4 random seeds
The performance for each of the systems is calculated by averaging the cumulative reward of each vehicle in
the 2 vehicle 2 platoon system, as summarized in Table 4. For each of the 3 cases (base case, Inter-FRLGA and
Inter-FRLWA),trainingsessionswererun using4 randomseeds. In ordertodeterminethehighest performing
system overall, an average and standard deviation is obtained from the result of training using the 4 random
seeds. FromTable4,itisobservedthatbothInter-FRLscenariosusinggradientandweightaggregationprovide
large performance increases to that of the base case.
3.2.2. Convergence properties
The cumulative reward is calculated over each training episode, and a moving average is computed over 40
episodes to generate Figure 6a-6f. It can be seen that the cumulative reward for Inter-FRLWA not only con-
verges more rapidly than both no-FRL and Inter-FRLGA, but Inter-FRLWA also appears to have a more stable
training session as indicated by the lower magnitude of the shaded area (the standard deviation across the four
random seeds).
3.2.2. Test results for one episode
In Figure 7a and 7b, a simulation is performed over a single training episode plotting the jerk, along with the
control input , , acceleration , , velocity error , , and position error , for each platoon. There are 2