
Page 219 - Read Online
P. 219
Page 4 of 9 Tang et al. Hepatoma Res 2019;5:19 I http://dx.doi.org/10.20517/2394-5079.2019.07
Figure 1. Flowchart program of selected studies
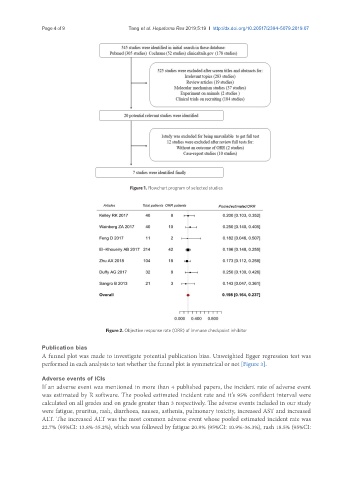
Figure 2. Objective response rate (ORR) of immune checkpoint inhibitor
Publication bias
A funnel plot was made to investigate potential publication bias. Unweighted Egger regression test was
performed in each analysis to test whether the funnel plot is symmetrical or not [Figure 3].
Adverse events of ICIs
If an adverse event was mentioned in more than 4 published papers, the incident rate of adverse event
was estimated by R software. The pooled estimated incident rate and it’s 95% confident interval were
calculated on all grades and on grade greater than 3 respectively. The adverse events included in our study
were fatigue, pruritus, rash, diarrhoea, nausea, asthenia, pulmonary toxicity, increased AST and increased
ALT. The increased ALT was the most common adverse event whose pooled estimated incident rate was
22.7% (95%CI: 13.8%-35.2%), which was followed by fatigue 20.9% (95%CI: 10.9%-36.3%), rash 18.5% (95%CI: