
Page 88 - Read Online
P. 88
Wada et al. Hepatoma Res 2018;4:8 I http://dx.doi.org/10.20517/2394-5079.2017.39 Page 5 of 8
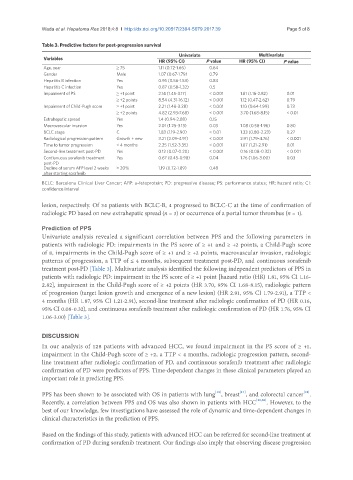
Table 3. Predictive factors for post-progression survival
Univariate Multivariate
Variables
HR (95% CI) P value HR (95% CI) P value
Age, year ≥ 75 1.11 (0.72-1.66) 0.64
Gender Male 1.07 (0.67-1.79) 0.79
Hepatitis B infection Yes 0.95 (0.56-1.53) 0.84
Hepatitis C infection Yes 0.87 (0.58-1.32) 0.5
Impairment of PS ≥ +1 point 2.14 (1.45-3.17) < 0.001 1.81 (1.16-2.82) 0.01
≥ +2 points 8.54 (4.31-16.12) < 0.001 1.12 (0.47-2.62) 0.79
Impairment of Child-Pugh score ≥ +1 point 2.21 (1.48-3.28) < 0.001 1.10 (0.64-1.99) 0.73
≥ +2 points 4.82 (2.93-7.68) < 0.001 3.70 (1.68-8.15) < 0.01
Extrahepatic spread Yes 1.4 (0.94-2.08) 0.15
Macrovascular invasion Yes 2.01 (1.25-3.13) 0.03 1.08 (0.58-1.96) 0.80
BCLC stage C 1.83 (1.19-2.90) < 0.01 1.33 (0.80-2.23) 0.27
Radiological progression pattern Growth + new 3.21 (2.09-4.91) < 0.001 2.91 (1.79-4.76) < 0.001
Time to tumor progression < 4 months 2.25 (1.52-3.35) < 0.001 1.87 (1.21-2.91) 0.01
Second-line treatment post-PD Yes 0.12 (0.07-0.20) < 0.001 0.16 (0.08-0.32) < 0.001
Contiunuous sorafenib treatment Yes 0.67 (0.45-0.98) 0.04 1.76 (1.06-3.00) 0.03
post-PD
Decline of serum AFP level 2 weeks > 20% 1.19 (0.72-1.89) 0.48
after starting sorafenib
BCLC: Barcelona Clinical Liver Cancer; AFP: a-fetoprotein; PD: progressive disease; PS: performance status; HR: hazard ratio; CI:
confidence interval
lesion, respectively. Of 34 patients with BCLC-B, 4 progressed to BCLC-C at the time of confirmation of
radiologic PD based on new extrahepatic spread (n = 3) or occurrence of a portal tumor thrombus (n = 1).
Prediction of PPS
Univariate analysis revealed a significant correlation between PPS and the following parameters in
patients with radiologic PD: impairments in the PS score of ≥ +1 and ≥ +2 points, a Child-Pugh score
of 8, impairments in the Child-Pugh score of ≥ +1 and ≥ +2 points, macrovascular invasion, radiologic
patterns of progression, a TTP of ≤ 4 months, subsequent treatment post-PD, and continuous sorafenib
treatment post-PD [Table 3]. Multivariate analysis identified the following independent predictors of PPS in
patients with radiologic PD: impairment in the PS score of ≥ +1 point [hazard ratio (HR) 1.81, 95% CI 1.16-
2.82], impairment in the Child-Pugh score of ≥ +2 points (HR 3.70, 95% CI 1.68-8.15), radiologic pattern
of progression (target lesion growth and emergence of a new lesion) (HR 2.91, 95% CI 1.79-2.91), a TTP <
4 months (HR 1.87, 95% CI 1.21-2.91), second-line treatment after radiologic confirmation of PD (HR 0.16,
95% CI 0.08-0.32), and continuous sorafenib treatment after radiologic confirmation of PD (HR 1.76, 95% CI
1.06-3.00) [Table 3].
DISCUSSION
In our analysis of 128 patients with advanced HCC, we found impairment in the PS score of ≥ +1,
impairment in the Child-Pugh score of ≥ +2, a TTP < 4 months, radiologic progression pattern, second-
line treatment after radiologic confirmation of PD, and continuous sorafenib treatment after radiologic
confirmation of PD were predictors of PPS. Time-dependent changes in these clinical parameters played an
important role in predicting PPS.
[18]
[16]
[17]
PPS has been shown to be associated with OS in patients with lung , breast , and colorectal cancer .
Recently, a correlation between PPS and OS was also shown in patients with HCC [19,20] . However, to the
best of our knowledge, few investigations have assessed the role of dynamic and time-dependent changes in
clinical characteristics in the prediction of PPS.
Based on the findings of this study, patients with advanced HCC can be referred for second-line treatment at
confirmation of PD during sorafenib treatment. Our findings also imply that observing disease progression