
Page 87 - Read Online
P. 87
Page 4 of 8 Wada et al. Hepatoma Res 2018;4:8 I http://dx.doi.org/10.20517/2394-5079.2017.39
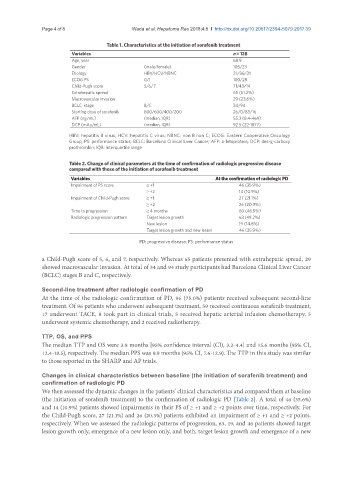
Table 1. Characteristics at the initiation of sorafenib treatment
Variables n = 128
Age, year 68.9
Gender (male/female) 105/23
Etiology HBV/HCV/NBNC 21/86/21
ECOG PS 0/1 100/28
Child-Pugh score 5/6/7 71/43/14
Extrahepatic spread 65 (51.2%)
Macrovascular invasion 29 (23.6%)
BCLC stage B/C 34/94
Starting dose of sorafenib 800/600/400/200 26/0/83/16
AFP (ng/mL) (median, IQR) 55.3 (8.4-469)
DCP (mAu/mL) (median, IQR) 92.5 (22-1877)
HBV: hepatitis B virus; HCV: hepatitis C virus; NBNC: non B non C; ECOG: Eastern Cooperative Oncology
Group; PS: performance status; BCLC: Barcelona Clinical Liver Cancer; AFP: a-fetoprotein; DCP: des-g-carboxy
prothrombin; IQR: interquartile range
Table 2. Change of clinical parameters at the time of confirmation of radiologic progressive disease
compared with those of the initiation of sorafenib treatment
Variables At the confirmation of radiologic PD
Impairment of PS score ≥ +1 46 (35.9%)
≥ +2 14 (10.9%)
Impairment of Child-Pugh score ≥ +1 27 (21.1%)
≥ +2 26 (20.3%)
Time to progression ≥ 4 months 60 (46.9%)
Radiologic progression pattern Target lesion growth 63 (49.2%)
New lesion 19 (14.8%)
Target lesion growth and new lesion 46 (35.9%)
PD: progressive disease; PS: performance status
a Child-Pugh score of 5, 6, and 7, respectively. Whereas 65 patients presented with extrahepatic spread, 29
showed macrovascular invasion. At total of 34 and 94 study participants had Barcelona Clinical Liver Cancer
(BCLC) stages B and C, respectively.
Second-line treatment after radiologic confirmation of PD
At the time of the radiologic confirmation of PD, 96 (75.0%) patients received subsequent second-line
treatment. Of 96 patients who underwent subsequent treatment, 59 received continuous sorafenib treatment,
17 underwent TACE, 8 took part in clinical trials, 5 received hepatic arterial infusion chemotherapy, 5
underwent systemic chemotherapy, and 2 received radiotherapy.
TTP, OS, and PPS
The median TTP and OS were 3.8 months [95% confidence interval (CI), 3.2-4.4] and 15.6 months (95% CI,
12.4-18.5), respectively. The median PPS was 9.9 months (95% CI, 7.6-12.9). The TTP in this study was similar
to those reported in the SHARP and AP trials.
Changes in clinical characteristics between baseline (the initiation of sorafenib treatment) and
confirmation of radiologic PD
We then assessed the dynamic changes in the patients’ clinical characteristics and compared them at baseline
(the initiation of sorafenib treatment) to the confirmation of radiologic PD [Table 2]. A total of 46 (35.6%)
and 14 (10.9%) patients showed impairments in their PS of ≥ +1 and ≥ +2 points over time, respectively. For
the Child-Pugh score, 27 (21.1%) and 26 (20.3%) patients exhibited an impairment of ≥ +1 and ≥ +2 points,
respectively. When we assessed the radiologic patterns of progression, 63, 19, and 46 patients showed target
lesion growth only, emergence of a new lesion only, and both, target lesion growth and emergence of a new