
Page 741 - Read Online
P. 741
Page 6 of 11 Wu et al. Hepatoma Res 2018;4:66 I http://dx.doi.org/10.20517/2394-5079.2018.87
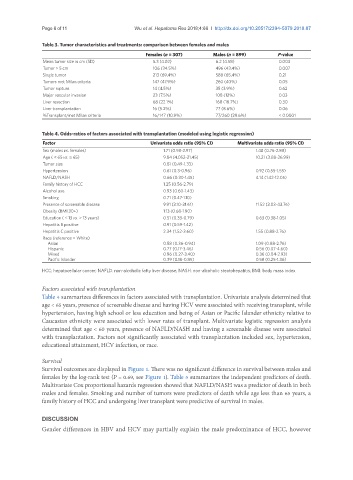
Table 3. Tumor characteristics and treatments: comparison between females and males
Females (n = 307) Males (n = 899) P-value
Mean tumor size in cm (SD) 5.3 (4.02) 6.2 (4.58) 0.003
Tumor > 5 cm 106 (34.5%) 496 (43.4%) 0.007
Single tumor 213 (69.4%) 588 (65.4%) 0.21
Tumors met Milan criteria 147 (47.9%) 260 (40%) 0.05
Tumor rupture 14 (4.5%) 35 (3.9%) 0.62
Major vascular invasion 23 (7.5%) 108 (12%) 0.03
Liver resection 68 (22.1%) 168 (18.7%) 0.30
Liver transplantation 16 (5.2%) 77 (8.6%) 0.06
%Transplant/met Milan criteria 16/147 (10.9%) 77/260 (29.6%) < 0.0001
Table 4. Odds-ratios of factors associated with transplantation (modeled using logistic regression)
Factor Univariate odds ratio (95% CI) Multivariate odds ratio (95% CI)
Sex (males vs. females) 1.71 (0.98-2.97) 1.48 (0.76-2.88)
Age ( < 65 vs. ≥ 65) 9.84 (4.052-21.45) 10.21 (3.88-26.99)
Tumor size 0.81 (0.49-1.33)
Hypertension 0.61 (0.3-0.96) 0.92 (0.55-1.55)
NAFLD/NASH 0.66 (0.30-1.45) 4.14 (1.42-12.05)
Family history of HCC 1.25 (0.56-2.79)
Alcohol use 0.93 (0.60-1.43)
Smoking 0.71 (0.47-1.10)
Presence of screenable disease 9.91 (3.10-31.61) 11.52 (3.03-43.76)
Obesity (BMI 30+) 1.13 (0.68-1.90)
Education ( ≤ 13 vs. > 13 years) 0.51 (0.33-0.79) 0.63 (0.38-1.05)
Hepatitis B positive 0.91 (0.59-1.42)
Hepatitis C positive 2.34 (1.52-3.60) 1.55 (0.88-2.76)
Race (reference = White)
Asian 0.58 (0.36-0.94) 1.09 (0.88-2.76)
Hispanic 0.77 (0.17-3.46) 0.56 (0.07-4.60)
Mixed 0.96 (0.27-3.40) 0.36 (0.04-2.93)
Pacific Islander 0.39 (0.18-0.85) 0.58 (0.25-1.36)
HCC: hepatocellular cancer; NAFLD: non-alcoholic fatty liver disease; NASH: non-alcoholic steatohepatitis; BMI: body mass index
Factors associated with transplantation
Table 4 summarizes differences in factors associated with transplantation. Univariate analysis determined that
age < 65 years, presence of screenable disease and having HCV were associated with receiving transplant, while
hypertension, having high school or less education and being of Asian or Pacific Islander ethnicity relative to
Caucasian ethnicity were associated with lower rates of transplant. Multivariate logistic regression analysis
determined that age < 60 years, presence of NAFLD/NASH and having a screenable disease were associated
with transplantation. Factors not significantly associated with transplantation included sex, hypertension,
educational attainment, HCV infection, or race.
Survival
Survival outcomes are displayed in Figure 1. There was no significant difference in survival between males and
females by the log-rank test (P = 0.69, see Figure 1). Table 5 summarizes the independent predictors of death.
Multivariate Cox proportional hazards regression showed that NAFLD/NASH was a predictor of death in both
males and females. Smoking and number of tumors were predictors of death while age less than 65 years, a
family history of HCC and undergoing liver transplant were predictive of survival in males.
DISCUSSION
Gender differences in HBV and HCV may partially explain the male predominance of HCC, however