
Page 740 - Read Online
P. 740
Wu et al. Hepatoma Res 2018;4:66 I http://dx.doi.org/10.20517/2394-5079.2018.87 Page 5 of 11
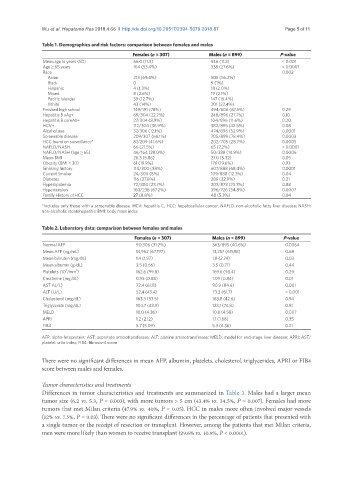
Table 1. Demographics and risk factors: comparison between females and males
Females (n = 307) Males (n = 899) P-value
Mean age in years (SD) 66.0 (11.3) 61.6 (11.3) < 0.001
Age ≥ 65 years 164 (53.4%) 338 (27.6%) < 0.0001
Race 0.002
Asian 213 (69.4%) 505 (56.2%)
Black 0 9 (1%)
Hispanic 4 (1.3%) 18 (2.0%)
Mixed 8 (2.6%) 19 (2.1%)
Pacific Islander 39 (12.7%) 147 (16.4%)
White 43 (14%) 201 (22.4%)
Finished high school 149/191 (78%) 494/606 (87.5%) 0.29
Hepatitis B sAg+ 69/304 (22.7%) 248/896 (27.7%) 0.10
Hepatitis B coreAb+ 27/304 (8.9%) 104/896 (11.6%) 0.20
HCV+ 112/304 (36.9%) 382/895 (42.5%) 0.08
Alcohol use 37/306 (12.1%) 474/896 (52.9%) 0.0001
Screenable disease 209/307 (68.1%) 705/899 (78.4%) 0.0003
HCC found on surveillance* 87/209 (41.6%) 202/705 (28.7%) 0.0005
NAFLD/NASH 66 (21.5%) 65 (7.2%) < 0.0001
NAFLD/NASH (age ≥ 65) 46/164 (28.0%) 50/338 (14.8%) 0.0006
Mean BMI 26.3 (5.86) 27.0 (5.32) 0.05
Obesity (BMI ≥ 30) 61 (19.9%) 176 (19.6%) 0.93
Smoking history 114/300 (38%) 607/888 (68.4%) 0.0001
Current Smoker 24/300 (8%) 109/888 (12.3%) 0.04
Diabetes 116 (37.8%) 289 (32.9%) 0.21
Hyperlipidemia 72/304 (23.7%) 203/873 (23.3%) 0.88
Hypertension 160/238 (67.2%) 396/726 (54.8%) 0.0007
Family History of HCC 27 (8.8%) 48 (5.3%) 0.04
*Includes only those with a screenable disease. HCV: hepatitis C; HCC: hepatocellular cancer; NAFLD: non-alcoholic fatty liver disease; NASH:
non-alcoholic steatohepatitis; BMI: body mass index
Table 2. Laboratory data: comparison between females and males
Females (n = 307) Males (n = 899) P-value
Normal AFP 97/306 (31.7%) 363/895 (40.6%) 0.0064
Mean AFP (ng/mL) 14,962 (67797) 13,257 (61588) 0.68
Mean bilirubin (mg/dL) 1.4 (1.97) 1.8 (2.74) 0.03
Mean albumin (g/dL) 3.5 (0.66) 3.5 (0.71) 0.44
3
3
Platelets (10 /mm ) 162.6 (99.8) 169.6 (98.4) 0.29
Creatinine (mg/dL) 0.95 (0.88) 1.09 (0.84) 0.01
AST (U/L) 72.4 (61.8) 90.9 (84.6) 0.001
ALT (U/L) 52.4 (43.4) 73.3 (61.7) < 0.001
Cholesterol (mg/dL) 163.3 (53.5) 163.8 (42.6) 0.94
Triglyceride (mg/dL) 104.7 (43.9) 123.1 (74.8) 0.81
MELD 10.0 (4.36) 10.8 (4.58) 0.007
APRI 1.2 (2.12) 1.1 (1.68) 0.35
FIB4 5.7 (5.09) 5.3 (4.36) 0.21
AFP: alpha-fetoprotein; AST: aspartate aminotransferase; ALT: alanine aminotransferase; MELD: model for end-stage liver disease; APRI: AST/
platelet ratio index; FIB4: fibrosis-4 score
There were no significant differences in mean AFP, albumin, platelets, cholesterol, triglycerides, APRI or FIB4
score between males and females.
Tumor characteristics and treatments
Differences in tumor characteristics and treatments are summarized in Table 3. Males had a larger mean
tumor size (6.2 vs. 5.3, P = 0.003), with more tumors > 5 cm (43.4% vs. 34.5%, P = 0.007). Females had more
tumors that met Milan criteria (47.9% vs. 40%, P = 0.05). HCC in males more often involved major vessels
(12% vs. 7.5%, P = 0.03). There were no significant differences in the percentage of patients that presented with
a single tumor or the receipt of resection or transplant. However, among the patients that met Milan criteria,
men were more likely than women to receive transplant (29.6% vs. 10.9%, P < 0.0001).