Page 126 - Read Online
P. 126

Page 6 of 11                        Paranaguá-Vezozzo et al. Hepatoma Res 2018;4:11  I  http://dx.doi.org/10.20517/2394-5079.2018.17


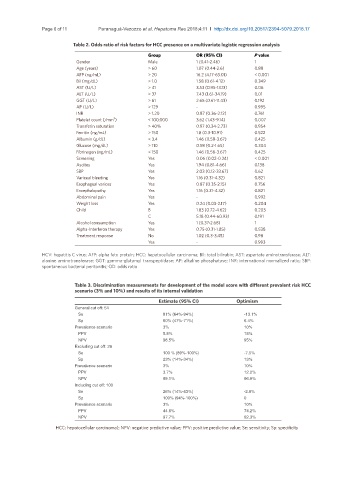
                          Table 2. Odds ratio of risk factors for HCC presence on a multivariate logistic regression analysis
                                                   Group           OR (95% CI)         P value
                           Gender                  Male            1 (0.41-2.46)       1
                           Age (years)             > 60            1.07 (0.44-2.6)     0.88
                           AFP (ng/mL)             > 20            16.2 (4.17-63.01)   < 0.001
                           Bil (mg/dL)             > 1.0           1.58 (0.61-4.12)    0.349
                           AST (U/L)               > 41            3.53 (0.95-13.13)   0.06
                           ALT (U/L)               > 37            7.43 (1.61-34.19)   0.01
                           GGT (U/L)               > 61            2.65 (0.61-11.43)   0.192
                           AP (U/L)                > 129           -                   0.995
                           INR                     > 1.20          0.87 (0.36-2.12)    0.761
                                       3
                           Platelet count (/mm )   < 100,000       3.62 (1.43-9.14)    0.007
                           Transferin saturation   > 40%           0.97 (0.34-2.73)    0.954
                           Ferritin (ng/mL)        > 150           1.8 (0.3-10.91)     0.522
                           Albumin (g/dL)          < 3.4           1.46 (0.58-3.67)    0.425
                           Glucose (mg/dL)         > 110           0.58 (0.2-1.65)     0.304
                           Fibrinogen (ng/mL)      < 150           1.46 (0.58-3.67)    0.425
                           Screening               Yes             0.06 (0.02-0.24)    < 0.001
                           Ascites                 Yes             1.94 (0.81-4.66)    0.138
                           SBP                     Yes             2.03 (0.12-33.67)   0.62
                           Variceal bleeding       Yes             1.16 (0.31-4.32)    0.821
                           Esophageal varices      Yes             0.87 (0.35-2.15)    0.756
                           Encephalopathy          Yes             1.16 (0.31-4.32)    0.821
                           Abdominal pain          Yes             -                   0.992
                           Weight loss             Yes             0.24 (0.03-2.17)    0.204
                           Child                   B               1.83 (0.72-4.62)    0.203
                                                   C               5.18 (0.44-60.93)   0.191
                           Alcohol consumption     Yes             1 (0.37-2.68)       1
                           Alpha-Interferon therapy  Yes           0.75 (0.31-1.85)    0.538
                           Treatment response      No              1.02 (0.3-3.45)     0.98
                                                   Yes             -                   0.993

               HCV: hepatitis C virus; AFP: alpha feto protein; HCC: hepatocellular carcinoma; Bil: total bilirubin; AST: aspartate aminotransferase; ALT:
               alanine aminotransferase; GGT: gamma-glutamyl transpeptidase; AP: alkaline phosphatase; INR: international normalized ratio; SBP:
               spontaneous bacterial peritonitis; OD: odds ratio

                          Table 3. Discrimination measurements for development of the model score with different prevalent risk HCC
                          scenario (3% and 10%) and results of its internal validation

                                                       Estimate (95% CI)         Optimism
                          General cut off: 54
                             Se                         81% (64%-94%)              -13.1%
                             Sp                         60% (47%-71%)              6.4%
                          Prevalence scenario           3%                         10%
                             PPV                        5.8%                       18%
                             NPV                        98.5%                      95%
                          Excluding cut off: 26
                             Se                         100 % (89%-100%)           -7.5%
                             Sp                         23% (14%-34%)              13%
                          Prevalence scenario           3%                         10%
                             PPV                        3.7%                       12.2%
                             NPV                        99.1%                      96.9%
                          Including cut off: 100
                             Se                         26% (14%-43%)              -2.6%
                             Sp                         100% (94%-100%)            0
                          Prevalence scenario           3%                         10%
                             PPV                        44.6%                      74.2%
                             NPV                        97.7%                      92.3%
                    HCC: hepatocellular carcinoma); NPV: negative predictive value; PPV: positive predictive value; Se: sensitivity; Sp: specificity
   121   122   123   124   125   126   127   128   129   130   131