
Page 124 - Read Online
P. 124
Page 4 of 11 Paranaguá-Vezozzo et al. Hepatoma Res 2018;4:11 I http://dx.doi.org/10.20517/2394-5079.2018.17
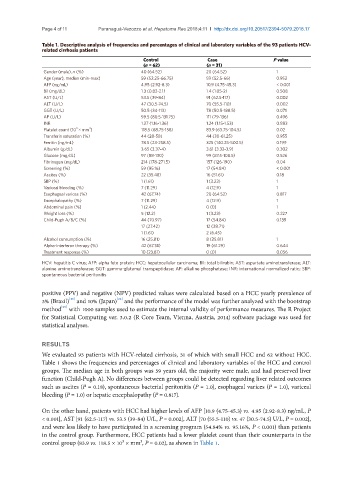
Table 1. Descriptive analysis of frequencies and percentages of clinical and laboratory variables of the 93 patients HCV-
related cirrhosis patients
Control Case P value
(n = 62) (n = 31)
Gender (male), n (%) 40 (64.52) 20 (64.52) 1
Age (year), median (min-max) 59 (52.25-66.75) 59 (52.5-66) 0.952
AFP (ng/mL) 4.95 (2.92-8.3) 10.9 (4.75-45.3) < 0.001
Bil (mg/dL) 1.3 (0.82-2.1) 1.4 (1.05-2) 0.508
AST (U/L) 53.5 (39-84) 91 (62.5-117) 0.002
ALT (U/L) 47 (30.5-74.5) 70 (55.5-110) 0.002
GGT (U/L) 50.5 (34-113) 78 (50.5-188.5) 0.071
AP (U/L) 99.5 (80.5-131.75) 111 (79-136) 0.496
INR 1.27 (1.16-1.36) 1.24 (1.15-1.53) 0.883
3
3
Platelet count (10 × mm ) 118.5 (68.75-158) 83.9 (63.75-104.5) 0.02
Transferin saturation (%) 44 (28-58) 44 (30-61.25) 0.955
Ferritin (ng/mL) 78.5 (23-258.5) 325 (140.25-500.5) 0.199
Albumin (g/dL) 3.65 (3.37-4) 3.61 (3.32-3.9) 0.302
Glucose (mg/dL) 97 (88-130) 99 (87.5-108.5) 0.526
Fibrinogen (mg/dL) 214 (178-271.5) 157 (126-190) 0.04
Screening (%) 59 (95.16) 17 (54.84) < 0.001
Ascites (%) 22 (35.48) 16 (51.61) 0.18
SBP (%) 1 (1.61) 1 (3.23) 1
Variceal bleeding (%) 7 (11.29) 4 (12.9) 1
Esophageal varices (%) 42 (67.74) 20 (64.52) 0.817
Encephalopathy (%) 7 (11.29) 4 (12.9) 1
Abdominal pain (%) 1 (2.44) 0 (0) 1
Weight loss (%) 5 (12.2) 1 (3.23) 0.227
Child-Pugh A/B/C (%) 44 (70.97) 17 (54.84) 0.139
17 (27.42) 12 (38.71)
1 (1.61) 2 (6.45)
Alcohol consumption (%) 16 (25.81) 8 (25.81) 1
Alpha-interferon therapy (%) 42 (67.74) 19 (61.29) 0.644
Treatment response (%) 10 (23.81) 0 (0) 0.056
HCV: hepatitis C virus; AFP: alpha feto protein; HCC: hepatocellular carcinoma; Bil: total bilirubin; AST: aspartate aminotransferase; ALT:
alanine aminotransferase; GGT: gamma-glutamyl transpeptidase; AP: alkaline phosphatase; INR: international normalized ratio; SBP:
spontaneous bacterial peritonitis
positive (PPV) and negative (NPV) predicted values were calculated based on a HCC yearly prevalence of
[24]
[16]
3% (Brazil) and 10% (Japan) and the performance of the model was further analyzed with the bootstrap
[25]
method with 1000 samples used to estimate the internal validity of performance measures. The R Project
for Statistical Computing ver. 3.0.2 (R Core Team, Vienna, Austria, 2014) software package was used for
statistical analyses.
RESULTS
We evaluated 93 patients with HCV-related cirrhosis, 31 of which with small HCC and 62 without HCC.
Table 1 shows the frequencies and percentages of clinical and laboratory variables of the HCC and control
groups. The median age in both groups was 59 years old, the majority were male, and had preserved liver
function (Child-Pugh A). No differences between groups could be detected regarding liver related outcomes
such as ascites (P = 0.18), spontaneous bacterial peritonitis (P = 1.0), esophageal varices (P = 1.0), variceal
bleeding (P = 1.0) or hepatic encephalopathy (P = 0.817).
On the other hand, patients with HCC had higher levels of AFP [10.9 (4.75-45.3) vs. 4.95 (2.92-8.3) ng/mL, P
< 0.001], AST [91 (62.5-117) vs. 53.5 (39-84) U/L, P = 0.002], ALT [70 (55.5-110) vs. 47 (30.5-74.5) U/L, P = 0.002],
and were less likely to have participated in a screening program (54.84% vs. 95.16%, P < 0.001) than patients
in the control group. Furthermore, HCC patients had a lower platelet count than their counterparts in the
control group (83.9 vs. 118.5 × 10³ × mm³, P = 0.02), as shown in Table 1.