
Page 139 - Read Online
P. 139
D’Arcangelo et al. Hepatoma Res 2021;7:4 I http://dx.doi.org/10.20517/2394-5079.2020.109 Page 5 of 12
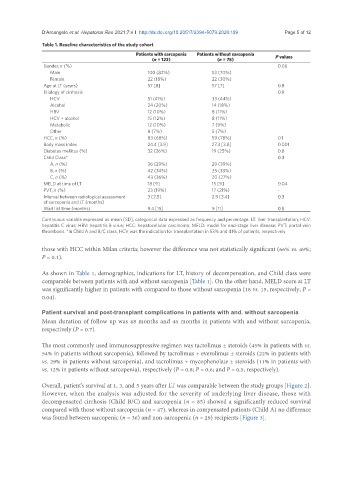
Table 1. Baseline characteristics of the study cohort
Patients with sarcopenia Patients without sarcopenia
(n = 122) (n = 75) P values
Gender, n (%) 0.06
Male 100 (82%) 53 (70%)
Female 22 (18%) 22 (30%)
Age at LT (years) 57 [8] 57 [7] 0.8
Etiology of cirrhosis 0.9
HCV 51 (41%) 33 (44%)
Alcohol 24 (20%) 14 (18%)
HBV 12 (10%) 8 (11%)
HCV + alcohol 15 (12%) 8 (11%)
Metabolic 12 (10%) 7 (9%)
Other 8 (7%) 5 (7%)
HCC, n (%) 83 (68%) 59 (78%) 0.1
Body mass index 24.4 [3.9] 27.3 [3.8] 0.001
Diabetes mellitus (%) 32 (26%) 19 (25%) 0.8
Child Class* 0.3
A, n (%) 36 (29%) 29 (39%)
B, n (%) 42 (34%) 25 (33%)
C, n (%) 43 (36%) 20 (27%)
MELD at time of LT 18 [9] 15 [9] 0.04
PVT, n (%) 23 (19%) 17 (21%) -
Interval between radiological assessment 3 [2.5] 2.9 [3.4] 0.3
of sarcopenia and LT (months)
Wait list time (months) 9.4 [15] 9 [11] 0.8
Continuous variable expressed as mean [SD], categorical data expressed as frequency and percentage. LT: liver transplantation; HCV:
hepatitis C virus; HBV: hepatitis B virus; HCC: hepatocellular carcinoma; MELD: model for end-stage liver disease; PVT: portal vein
thrombosis. *In Child A and B/C class, HCV was the indication for transplantation in 53% and 41% of patients, respectively
those with HCC within Milan criteria; however the difference was not statistically significant (66% vs. 49%;
P = 0.1).
As shown in Table 1, demographics, indications for LT, history of decompensation, and Child class were
comparable between patients with and without sarcopenia [Table 1]. On the other hand, MELD score at LT
was significantly higher in patients with compared to those without sarcopenia (18 vs. 15, respectively; P =
0.04).
Patient survival and post-transplant complications in patients with and. without sarcopenia
Mean duration of follow up was 48 months and 46 months in patients with and without sarcopenia,
respectively (P = 0.7).
The most commonly used immunosuppressive regimen was tacrolimus ± steroids (45% in patients with vs.
54% in patients without sarcopenia), followed by tacrolimus + everolimus ± steroids (22% in patients with
vs. 29% in patients without sarcopenia), and tacrolimus + mycophenolate ± steroids (11% in patients with
vs. 12% in patients without sarcopenia), respectively (P = 0.8; P = 0.6; and P = 0.5, respectively).
Overall, patient’s survival at 1, 3, and 5 years after LT was comparable between the study groups [Figure 2].
However, when the analysis was adjusted for the severity of underlying liver disease, those with
decompensated cirrhosis (Child B/C) and sarcopenia (n = 85) showed a significantly reduced survival
compared with those without sarcopenia (n = 47), whereas in compensated patients (Child A) no difference
was found between sarcopenic (n = 36) and non-sarcopenic (n = 29) recipients [Figure 3].