Page 11 - Read Online
P. 11

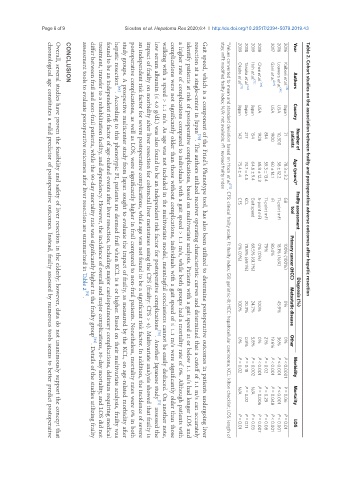
Page 6 of 9                                               Sioutas et al. Hepatoma Res 2020;6:4  I  http://dx.doi.org/10.20517/2394-5079.2019.43  Table 2. Cohort studies on the association between frailty and postoperative adverse outcomes after hepatic resection


                                                                                            2017
                                                                                                    Year
                                                                                               2016
                                                                                 2019
                                                                                                 2016
                                                                                        2018
                                                                                      2019
                                                                                    2018
                       CONCLUSION
                                                                                      Itoh et al. [70]
                                                                                            Gani et al. [49]
                                                                                        Chen et al. [69]
                                                                                 Okabe et al. [71]
                                                                                                    Authors
                                                                                                 Kaibori et al. [53]
                                                                                    Tanaka et al. [64]
                                                                                               Louwers et al. [48]
                                                                                            USA
                                                                                        USA
                                                                                               USA
                                                                                 Japan
                                                                                    Japan
                                                                                      Japan
                                                                                                 Japan
                                                                                                    Country
                                                                                                 71
                                                                                    217
                                                                                      154
                                                                                          814
                                                                                 143
                                                                                        1928
                                                                                            1900
                                                                                               10,300
                                                                                                   patients
                                                                                                     Number of
                                                                                 75.4 ± 4
                                                                                            60 ± 14.1
                                                                                               58 ± 12.2
                                                                                                 78.3 ± 3.2
                                                                                    74.7 ± 4.5
                                                                                      64.6 ± 9.4
                                                                                          59.3 ± 13.4
                                                                                        58.8 ± 12.3
                                                                                                    Age (years)*
                                                                            stay; mFI: modified frailty index; N/A: not available; rFI: revised frailty index
                                                                                            rFI
                                                                                                 G8
                                                                                 CFS
                                                                                    KCL
                                                                                                   tool
                                                                                      Gait speed
                                                                                        5-point mFI
                                                                                               11-point mFI
                                                                                          11-point mFI
                                                                                                     Frailty assessment
                                                                                          79%
                                                                                            80.4%
                                                                                 0% (0%)
                                                                                        0% (0%)
                                                                                               18.1% (N/A)
                                                                                                 100% (100%)
                                                                                      69.5% (61.7%)
                                                                                    78.8% (69.1%)
                                                                                                   Primary cancer (HCC)
                             assessment tools to evaluate postoperative outcomes after liver resection are summarized in Table 2 [72] .
                                                                                                     Diagnosis (%)
                                                                                                 0%
                                                                                 100%
                                                                                        100%
                                                                                      24.7%
                                                                                    20.3%
                                                                                               45.9%
                                                                                                   Metastatic disease
                                                                                                 0%
                                                                                 0%
                                                                                        0%
                                                                                          21%
                                                                                               36%
                                                                                      5.8%
                                                                                                   Other
                                                                                    0.9%
                                                                                            19.6%
                                                                                    P = 0.18
                                                                                          P = 0.02
                                                                                 P = 0.02
                                                                                               P < 0.001
                                                                                        P < 0.001
                                                                                            P < 0.001
                                                                                      P = 0.002
                                                                                                    Morbidity
                                                                                                 P < 0.0001
                                                                                      N/A
                                                                                 N/A
                                                                                                 P = 0.06
                                                                                    P = 0.02
                                                                                          P = 0.29
                                                                                               P < 0.001
                                                                                        P = 0.006
                                                                                            P = 0.048
                                                                                                    Mortality
                                                                                                    LOS
                                                                                    P = 0.11
                                                                                                 P = 0.01
                                                                                 P = 0.01
                                                                                      P = 0.03
                                                                                          P = 0.08
                                                                                               P < 0.001
                                                                                            P < 0.001
                                                                                        P = 0.007
                                                                   resection at a single-center in Japan [70] . The authors utilized receiver operating characteristic curves and determined that a cutoff of 1.1 m/s can accurately
                                                           complications were not significantly older than those without complications, individuals with a gait speed of ≤ 1.1 m/s were significantly older than those
                                                an independent risk factor for severe postoperative complications, while age was not found to be a significant risk factor. In addition, the incidence of severe
                                                                              *Values converted to mean and standard deviation based on Hozo et al. [72] . CFS: clinical frailty scale; FI: frailty index; G8: geriatric-8; HCC: hepatocellular carcinoma; KCL: kihon checklist; LOS: length of
                                                             a higher rate of complications compared to individuals with a gait speed > 1.1 m/s, while both groups had a mortality rate of 0%. Although patients with
                    Overall, several studies have proven the feasibility and safety of liver resection in the elderly; however, data do not unanimously support the concept that
                 chronological age constitutes a valid predictor of postoperative outcomes. Instead, frailty assessed by numerous tools seems to better predict postoperative
                                                                      Gait speed, which is a component of the Fried’s Phenotype tool, has also been utilized to determine postoperative outcomes in patients undergoing liver
                                                                identify patients at risk of postoperative complications, based on multivariate analysis. Patients with a gait speed at or below 1.1 m/s had longer LOS and
                                differ between frail and non-frail patients, while the 90-day mortality rate was significantly higher in the frailty group [64] . Details of the studies utilizing frailty
                                                   impact of frailty on morbidity after liver resection for colorectal liver metastases using the CFS (frailty: CFS > 4). Multivariate analysis showed that frailty is
                                                     low serum albumin (≤ 4.0 g/dL) was also found to be an independent risk factor for postoperative complications [70] . Another Japanese study [71]  assessed the
                                           study groups. A prospective multicenter study from Japan sought to evaluate the impact of frailty, as measured by the KCL, on age-related morbidity after
                                             postoperative complications, as well as LOS, were significantly higher in frail compared to non-frail patients. Nonetheless, mortality rates were 0% in both
                                     found to be an independent risk factor of age-related events after liver resection, including major cardiopulmonary complications, delirium requiring medical
                                  treatment, transfer to a rehabilitation facility, and dependency. However, the incidence of overall and major complications, 30-day mortality, and LOS did not
                                                        walking with a speed > 1.1 m/s. As age was not included in the multivariate model, meaningful conclusions cannot be easily deduced. On another note,
                                        hepatic resection [64] . According to this phenotypic FI, patients are deemed frail when KCL is 8 or higher. Based on their multivariate analysis, frailty was
   6   7   8   9   10   11   12   13   14   15   16