
Page 84 - Read Online
P. 84
Yang et al. Hepatoma Res 2020;6:31 I http://dx.doi.org/10.20517/2394-5079.2019.45 Page 3 of 8
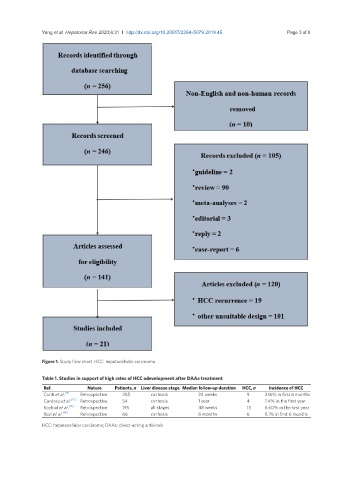
Figure 1. Study flow chart. HCC: hepatocellular carcinoma
Table 1. Studies in support of high rates of HCC odevelopment after DAAs treatment
Ref. Nature Patients, n Liver disease stage Median follow-up duration HCC, n Incidence of HCC
Conti et al. [11] Retrospective 285 cirrhosis 24 weeks 9 3.16% in first 6 months
Cardoso et al. [12] Retrospective 54 cirrhosis 1 year 4 7.4% in the first year
Kozbial et al. [13] Retrospective 195 all stages 48 weeks 13 6.60% in the first year
Ravi et al. [14] Retrospective 66 cirrhosis 6 months 6 9.1% in first 6 months
HCC: hepatocellular carcinoma; DAAs: direct-acting antivirals