Page 227 - Read Online
P. 227

Page 4 of 9                                              Lugaresi et al. Hepatoma Res 2018;4:67  I  http://dx.doi.org/10.20517/2394-5079.2018.88


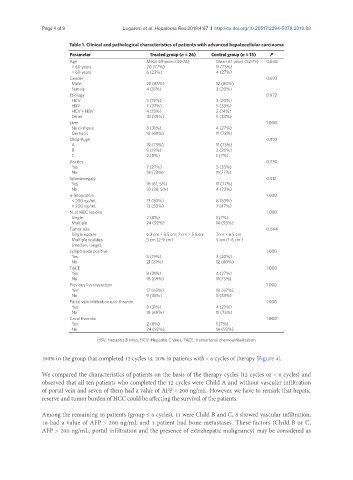
                        Table 1. Clinical and pathological characteristics of patients with advanced hepatocellular carcinoma
                         Parameter                  Treated group (n = 26)  Control group (n = 15)  P
                         Age                      Mean 69 years (49-76)   Mean 67 years (52-75)  0.648
                           > 60 years             20 (77%)                11 (73%)
                           < 60 years             6 (23%)                 4 (27%)
                         Gender                                                            0.693
                           Male                   22 (85%)                12 (80%)
                           Female                 4 (15%)                 3 (20%)
                         Etiology                                                          0.972
                           HCV                    5 (19%)                 3 (20%)
                           HBV                    7 (27%)                 5 (33%)
                           HCV + HBV              4 (15%)                 2 (14%)
                           Other                  10 (39%)                5 (33%)
                         Liver                                                             1.000
                           No cirrhosis           8 (31%)                 4 (27%)
                           Cirrhosis              18 (69%)                11 (73%)
                         Child-Pugh                                                        0.992
                           A                      19 (73%)                11 (73%)
                           B                      5 (19%)                 3 (20%)
                           C                      2 (8%)                  1 (7%)
                         Ascites                                                           0.730
                           Yes                    7 (27%)                 5 (33%)
                           No                     19 (73%)                11(77%)
                         Splenomegaly                                                      0.512
                           Yes                    16 (61, 5%)             11 (77%)
                           No                     10 (38, 5%)             4 (23%)
                         α-fetoprotein                                                     1.000
                           < 200 ng/mL            13 (50%)                8 (53%)
                           > 200 ng/mL            13 (50%)                7 (47%)
                         N. of HCC lesions                                                 1.000
                           Single                 2 (8%)                  1 (7%)
                           Multiple               24 (92%)                14 (93%)
                         Tumor size                                                        0.644
                           Single nodule          6.3 cm × 5.5 cm; 7 cm × 5.5 cm  7cm × 6.5 cm
                           Multiple nodules       5 cm (2-9 cm)           5 cm (1-8 cm )
                           (median, range)
                         Lymph node positive                                               1.000
                           Yes                    5 (19%)                 3 (20%)
                           No                     21 (81%)                12 (80%)
                         TACE                                                              1.000
                           Yes                    8 (31%)                 4 (27%)
                           No                     18 (69%)                11(73%)
                         Previous liver resection                                          1.000
                           Yes                    17 (65%)                10 (67%)
                           No                     9 (35%)                 5 (33%)
                         Portal vein infiltration e/or thrombi                             1.000
                           Yes                    8 (31%)                 4 (27%)
                           No                     18 (69%)                11 (73%)
                         Caval thrombi                                                     1.000
                           Yes                    2 (8%)                  1 (7%)
                           No                     24 (92%)                14 (93%)
                                  HBV: Hepatitis B virus; HCV: Hepatitis C virus; TACE: transarterial chemoembolization

               100% in the group that completed 12 cycles vs. 20% in patients with < 6 cycles of therapy [Figure 4].


               We compared the characteristics of patients on the basis of the therapy cycles (12 cycles or < 6 cycles) and
               observed that all ten patients who completed the 12 cycles were Child A and without vascular infiltration
               of portal vein and seven of them had a value of AFP < 200 ng/mL. However, we have to remark that hepatic
               reserve and tumor burden of HCC could be affecting the survival of the patients.

               Among the remaining 16 patients (group ≤ 6 cycles), 11 were Child B and C, 8 showed vascular infiltration,
               10 had a value of AFP > 200 ng/mL and 1 patient had bone metastases. These factors (Child B or C,
               AFP > 200 ng/mL, portal infiltration and the presence of extrahepatic malignancy) may be considered as
   222   223   224   225   226   227   228   229   230   231   232