Page 113 - Read Online
P. 113

Zanetto et al. Hepatoma Res 2018;4:70  I  http://dx.doi.org/10.20517/2394-5079.2018.102                                           Page 3 of 16


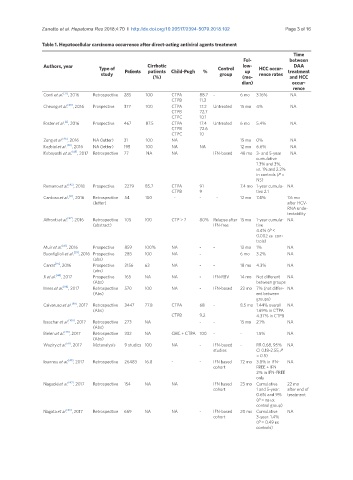
               Table 1. Hepatocellular carcinoma occurrence after direct-acting antiviral agents treatment
                                                                                                    Time
                                                                                   Fol-            between
                Authors, year     Type of          Cirrhotic               Control   low-  HCC occur-  DAA
                                   study   Patients  patients  Child-Pugh  %  group  up   rence rates  treatment
                                                     (%)                           (me-            and HCC
                                                                                   dian)            occur-
                                                                                                    rence
                Conti et al. [37] , 2016  Retrospective  285  100  CTPA  88.7  -  6 mo  3.16%      NA
                                                           CTPB     11.3
                Cheung et al. [40] , 2016  Prospective  377  100  CTPA   17.2  Untreated  15 mo  4%  NA
                                                           CTPB     72.7
                                                           CTPC     10.1
                       [2]
                Foster et al. , 2016  Prospective  467  87.5  CTPA   17.4  Untreated  6 mo  5.4%   NA
                                                           CTPB     72.6
                                                           CTPC     10
                Zeng et al. [96] , 2016  NA (letter)  31  100  NA                 15 mo  0%        NA
                Kozbial et al. [50] , 2016  NA (letter)  195  100  NA  NA         12 mo  6.6%      NA
                Kobayashi et al. [45] , 2017  Retrospective  77       NA  NA  IFN-based  48 mo 3- and 5-year   NA
                                                                                       cumulative
                                                                                       1.3% and 3%,
                                                                                       vs. 1% and 2.2%
                                                                                       in controls (P =
                                                                                       NS)
                Romano et al. [42] , 2018  Prospective  2279  85.7  CTPA  91      7.4 mo 1-year cumula- NA
                                                           CTPB     9                  tive 2.1
                        [51]
                Cardoso et al. , 2016   Retrospective   54  100  -  -     -       12 mo  7.4%     7.6 mo
                                (letter)                                                          after HCV-
                                                                                                  RNA unde-
                                                                                                  tectability
                Affronti et al. [47] , 2016   Retrospective  105  100  CTP > 7  80%  Relapse after  15 mo  1-year cumula- NA
                                (abstract)                               IFN-free      tive
                                                                                       4.4% (P <
                                                                                       0.002 vs. con-
                                                                                       trols)
                Muir et al. [41] , 2016   Prospective  859  100%  NA  -  -        12 mo  1%       NA
                Buonfiglioli et al. [39] , 2016  Prospective   285  100  NA  -    6 mo  3.2%      NA
                                (abs)
                Carrat [97] , 2016   Prospective   2156  63  NA     -    -        18 mo  4.3%     NA
                                (abs)
                Ji et al. [44] , 2017   Prospective   165  NA  NA   -    IFN-RBV  14 mo  Not different   NA
                                (Abs)                                                  between groups
                Innes et al. [98] , 2017   Retrospective   570  100  NA  -  IFN-based  22 mo 7% (not differ- NA
                                (Abs)                                                  ent between
                                                                                       groups)
                Calvaruso et al. [99] , 2017  Retrospective   3447  77.8  CTPA  68  -  8.5 mo 1.44% overall  NA
                                (Abs)                                                  1.69% in CTPA
                                                           CTPB     9.2                4.37% in CTPB
                Issachar et al. [100] , 2017   Retrospective   273  NA  -  -      15 mo  2.1%     NA
                                (Abs)
                Bielen et al. [48] , 2017   Retrospective   332  NA  CHC + CTPA 100  -  -  1.5%   NA
                                (Abs)
                Waziry et al. [61] , 2017  Metanalysis  9 studies 100  NA  -  IFN-based   -  RR 0.68, 95%   NA
                                                                         studies       CI 0.18-2.55, P
                                                                                       = 0.5)
                Ioannou et al. [49] , 2017  Retrospective  26483  16.8  -  -  IFN based   72 mo 3.8% in IFN-  NA
                                                                         cohort        FREE + IFN
                                                                                       2% in IFN-FREE
                                                                                       only
                Nagaoki et al. [43] , 2017  Retrospective  154  NA  NA   IFN based   23 mo Cumulative   22 mo
                                                                         cohort        1 and 5-year:   after end of
                                                                                       0.6% and 9%   treatment
                                                                                       (P = ns vs.
                                                                                       control group)
                Nagata et al. [46] , 2017  Retrospective  669  NA  NA  -  IFN-based   20 mo Cumulative   NA
                                                                         cohort        3-year: 1.4%
                                                                                       (P = 0.49 vs.
                                                                                       controls)
   108   109   110   111   112   113   114   115   116   117   118