
Page 80 - Read Online
P. 80
Yan et al. Energy Mater 2023;3:300002 https://dx.doi.org/10.20517/energymater.2022.60 Page 13 of 32
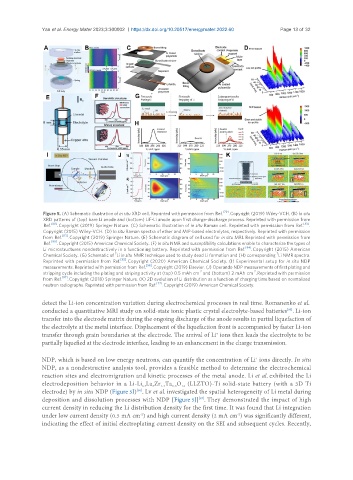
Figure 5. (A) Schematic illustration of in situ XRD cell. Reprinted with permission from Ref. [79] . Copyright (2019) Wiley-VCH. (B) In situ
XRD patterns of (top) bare Li anode and (bottom) LiF-Li anode upon first charge-discharge process. Reprinted with permission from
Ref. [80] . Copyright (2019) Springer Nature. (C) Schematic illustration of in situ Raman cell. Reprinted with permission from Ref. [81] .
Copyright (2015) Wiley-VCH. (D) In situ Raman spectra of ether and MIP-based electrolytes, respectively. Reprinted with permission
from Ref. [83] . Copyright (2019) Springer Nature. (E) Schematic diagram of cell used for in situ MRI. Reprinted with permission from
Ref. [90] . Copyright (2015) American Chemical Society. (F) In situ NMR and susceptibility calculations enable to characterize the types of
Li microstructures nondestructively in a functioning battery. Reprinted with permission from Ref. [94] . Copyright (2015) American
7
7
Chemical Society. (G) Schematic of Li in situ NMR technique used to study dead Li formation and (H) corresponding Li NMR spectra.
Reprinted with permission from Ref. [92] . Copyright (2020) American Chemical Society. (I) Experimental setup for in situ NDP
[96]
measurements. Reprinted with permission from Ref. . Copyright (2019) Elsevier. (J) Operando NDP measurements of first plating and
-2 -2
stripping cycle including the plating and striping activity at (top) 0.5 mAh cm and (bottom) 2 mAh cm . Reprinted with permission
[97]
from Ref. . Copyright (2018) Springer Nature. (K) 2D evolution of Li distribution as a function of charging time based on normalized
[77]
neutron radiographs. Reprinted with permission from Ref. . Copyright (2019) American Chemical Society.
detect the Li-ion concentration variation during electrochemical processes in real time. Romanenko et al.
[95]
conducted a quantitative MRI study on solid-state ionic plastic crystal electrolyte-based batteries . Li-ion
transfer into the electrode matrix during the ongoing discharge of the anode results in partial liquefaction of
the electrolyte at the metal interface. Displacement of the liquefaction front is accompanied by faster Li-ion
transfer through grain boundaries at the electrode. The arrival of Li ions then leads the electrolyte to be
+
partially liquefied at the electrode interface, leading to an enhancement in the charge transmission.
+
NDP, which is based on low energy neutrons, can quantify the concentration of Li ions directly. In situ
NDP, as a nondestructive analysis tool, provides a feasible method to determine the electrochemical
reaction sites and electromigration and kinetic processes of the metal anode. Li et al. exhibited the Li
electrodeposition behavior in a Li-Li La Zr Ta O (LLZTO)-Ti solid-state battery (with a 3D Ti
1.4
0.6
12
6.4
3
[96]
electrode) by in situ NDP (Figure 5I) . Lv et al. investigated the spatial heterogeneity of Li metal during
deposition and dissolution processes with NDP [Figure 5J] . They demonstrated the impact of high
[97]
current density in reducing the Li distribution density for the first time. It was found that Li integration
under low current density (0.5 mA cm ) and high current density (2 mA cm ) was significantly different,
-2
-2
indicating the effect of initial electroplating current density on the SEI and subsequent cycles. Recently,