


Page 102 - Read Online
P. 102
Yu et al. Carbon Footprints 2025, 4, 17  https://dx.doi.org/10.20517/cf.2025.12  Page 17 of 23


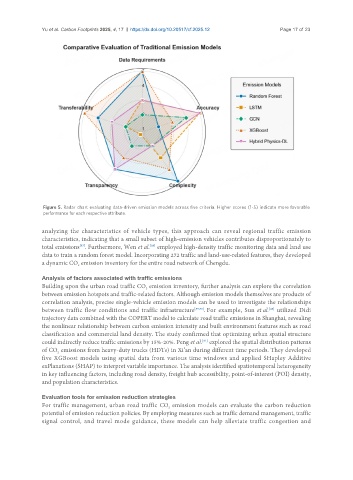
                Figure 5. Radar chart evaluating data-driven emission models across five criteria. Higher scores (1-5) indicate more favorable
                performance for each respective attribute.


               analyzing the characteristics of vehicle types, this approach can reveal regional traffic emission
               characteristics, indicating that a small subset of high-emission vehicles contributes disproportionately to
               total emissions . Furthermore, Wen et al.  employed high-density traffic monitoring data and land use
                                                    [88]
                            [87]
               data to train a random forest model. Incorporating 272 traffic and land-use-related features, they developed
               a dynamic CO  emission inventory for the entire road network of Chengdu.
                           2
               Analysis of factors associated with traffic emissions
               Building upon the urban road traffic CO  emission inventory, further analysis can explore the correlation
                                                  2
               between emission hotspots and traffic-related factors. Although emission models themselves are products of
               correlation analysis, precise single-vehicle emission models can be used to investigate the relationships
               between traffic flow conditions and traffic infrastructure [89,90] . For example, Sun et al.  utilized Didi
                                                                                            [45]
               trajectory data combined with the COPERT model to calculate road traffic emissions in Shanghai, revealing
               the nonlinear relationship between carbon emission intensity and built environment features such as road
               classification and commercial land density. The study confirmed that optimizing urban spatial structure
               could indirectly reduce traffic emissions by 15%-20%. Peng et al.  explored the spatial distribution patterns
                                                                     [91]
               of CO  emissions from heavy-duty trucks (HDTs) in Xi’an during different time periods. They developed
                    2
               five XGBoost models using spatial data from various time windows and applied SHapley Additive
               exPlanations (SHAP) to interpret variable importance. The analysis identified spatiotemporal heterogeneity
               in key influencing factors, including road density, freight hub accessibility, point-of-interest (POI) density,
               and population characteristics.

               Evaluation tools for emission reduction strategies
               For traffic management, urban road traffic CO  emission models can evaluate the carbon reduction
                                                          2
               potential of emission reduction policies. By employing measures such as traffic demand management, traffic
               signal control, and travel mode guidance, these models can help alleviate traffic congestion and

