Page 147 - Read Online
P. 147

Page 4 of 7                                        Andjelkov et al. Plast Aesthet Res 2018;5:18  I  http://dx.doi.org/10.20517/2347-9264.2017.96


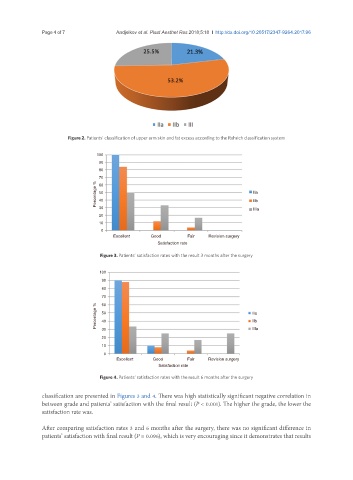
                        Figure 2. Patients’ classification of upper arm skin and fat excess according to the Rohrich classification system


                                  100
                                  90
                                  80
                                  70
                                 Percentage %  50                                     IIa
                                  60

                                  40
                                                                                      IIb
                                  30
                                  20                                                  IIIa
                                  10
                                   0
                                       Excellent                  Good                       Fair            Revision surgery
                                                      Satisfaction rate
                                   Figure 3. Patients’ satisfaction rates with the result 3 months after the surgery


                                   100
                                   90
                                   80
                                   70
                                   60
                                 Percentage %  50                                     IIa
                                                                                      IIb
                                   40
                                   30
                                   20                                                 IIIa
                                   10
                                    0
                                        Excellent                 Good                     Fair            Revision surgery
                                                      Satisfaction rate

                                   Figure 4. Patients’ satisfaction rates with the result 6 months after the surgery

               classification are presented in Figures 3 and 4. There was high statistically significant negative correlation in
               between grade and patients’ satisfaction with the final result (P < 0.001). The higher the grade, the lower the
               satisfaction rate was.

               After comparing satisfaction rates 3 and 6 months after the surgery, there was no significant difference in
               patients’ satisfaction with final result (P = 0.096), which is very encouraging since it demonstrates that results
   142   143   144   145   146   147   148   149   150   151   152