
Page 103 - Read Online
P. 103
Onishi et al. Plast Aesthet Res 2021;8:50 https://dx.doi.org/10.20517/2347-9264.2021.75 Page 5 of 9
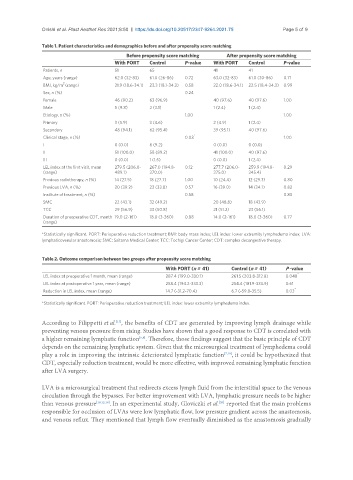
Table 1. Patient characteristics and demographics before and after propensity score matching
Before propensity score matching After propensity score matching
With PORT Control P-value With PORT Control P-value
Patients, n 51 65 41 41
Age, years (range) 62.0 (32-83) 61.0 (26-86) 0.72 63.0 (32-83) 61.0 (30-86) 0.71
2
BMI, kg/m (range) 21.9 (18.6-34.1) 23.3 (18.1-34.3) 0.58 22.0 (18.6-34.1) 22.5 (18.4-34.3) 0.99
Sex, n (%) 0.24
Female 46 (90.2) 63 (96.9) 40 (97.6) 40 (97.6) 1.00
Male 5 (9.8) 2 (3.1) 1 (2.4) 1 (2.4)
Etiology, n (%) 1.00 1.00
Primary 3 (5.9) 3 (4.6) 2 (4.9) 1 (2.4)
Secondary 48 (94.1) 62 (95.4) 39 (95.1) 40 (97.6)
Clinical stage, n (%) 0.03 * 1.00
I 0 (0.0) 6 (9.2) 0 (0.0) 0 (0.0)
II 51 (100.0) 58 (89.2) 41 (100.0) 40 (97.6)
III 0 (0.0) 1 (1.5) 0 (0.0) 1 (2.4)
LEL index at the first visit, mean 279.5 (206.0- 267.0 (194.8- 0.12 277.7 (206.0- 259.9 (194.8- 0.29
(range) 489.1) 370.0) 375.0) 345.4)
Previous radiotherapy, n (%) 14 (27.5) 18 (27.7) 1.00 10 (24.4) 12 (29.3) 0.80
Previous LVA, n (%) 20 (39.2) 22 (33.8) 0.57 16 (39.0) 14 (34.1) 0.82
Institute of treatment, n (%) 0.58 0.83
SMC 22 (43.1) 32 (49.2) 20 (48.8) 18 (43.9)
TCC 29 (56.9) 33 (50.8) 21 (51.2) 23 (56.1)
Duration of preoperative CDT, month 19.0 (2-161) 18.0 (3-360) 0.88 14.0 (2-161) 18.0 (3-360) 0.77
(range)
*Statistically significant. PORT: Perioperative reduction treatment; BMI: body mass index; LEL index: lower extremity lymphedema index; LVA:
lymphaticovenular anastomosis; SMC: Saitama Medical Center; TCC: Tochigi Cancer Center; CDT: complex decongestive therapy.
Table 2. Outcome comparison between two groups after propensity score matching
With PORT (n = 41) Control (n = 41) P -value
*
LEL index at preoperative 1 month, mean (range) 287.4 (199.0-330.1) 261.5 (203.8-312.8) 0.048
LEL index at postoperative 1 year, mean (range) 258.4 (194.2-333.3) 254.4 (181.9-333.9) 0.61
*
Reduction in LEL index, mean (range) 14.7 (-31.2-70.4) 6.7 (-59.8-35.5) 0.03
*Statistically significant. PORT: Perioperative reduction treatment; LEL index: lower extremity lymphedema index.
[17]
According to Filippetti et al. , the benefits of CDT are generated by improving lymph drainage while
preventing venous pressure from rising. Studies have shown that a good response to CDT is correlated with
[5,6]
a higher remaining lymphatic function . Therefore, those findings suggest that the basic principle of CDT
depends on the remaining lymphatic system. Given that the microsurgical treatment of lymphedema could
play a role in improving the intrinsic deteriorated lymphatic function [7,18] , it could be hypothesized that
CDT, especially reduction treatment, would be more effective, with improved remaining lymphatic function
after LVA surgery.
LVA is a microsurgical treatment that redirects excess lymph fluid from the interstitial space to the venous
circulation through the bypasses. For better improvement with LVA, lymphatic pressure needs to be higher
[20]
than venous pressure [10,12,19] . In an experimental study, Gloviczki et al. reported that the main problems
responsible for occlusion of LVAs were low lymphatic flow, low pressure gradient across the anastomosis,
and venous reflux. They mentioned that lymph flow eventually diminished as the anastomosis gradually