
Page 28 - Read Online
P. 28
Page 96 Jayanti et al. Neuroimmunol Neuroinflammation 2020;7:92-108 I http://dx.doi.org/10.20517/2347-8659.2019.14
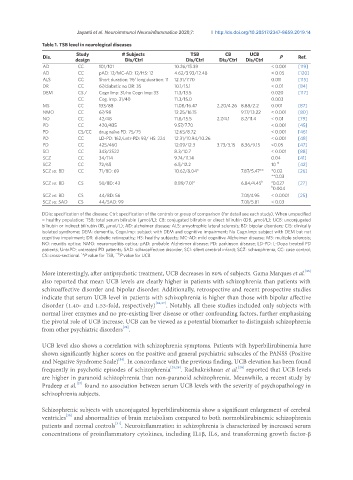
Table 1. TSB level in neurological diseases
Study # Subjects TSB CB UCB
Dis. P Ref.
design Dis/Ctrl Dis/Ctrl Dis/Ctrl Dis/Ctrl
AD CC 101/101 10.26/15.39 < 0.001 [119]
AD CC pAD: 12/MC-AD: 12/HS: 12 4.62/3.93/12.48 < 0.05 [120]
ALS CC Short duration: 19/ long duration: 11 12.31/7.70 0.011 [115]
DR CC 67/diabetic no DR: 35 10.1/15.1 < 0.01 [84]
DEM CS / Cogn Imp: 31/no Cogn Imp: 33 11.3/13.5 0.020 [117]
CC Cog. Imp. 31/40 11.3/15.0 0.003
MS CC 133/88 11.08/16.47 2.20/4.26 8.88/2.2 0.001 [87]
NMO CC 67/98 12.25/16.15 9.17/13.22 < 0.001 [80]
NO CC 42/48 11.8/15.5 2.7/4.1 8.7/11.4 < 0.01 [79]
PD CC 420/435 9.57/7.70 < 0.001 [45]
PD CS/CC drug naïve PD: 75/75 12.65/8.72 < 0.001 [46]
PD CC LD-PD: 162/untr-PD: 93/ HS: 224 12.31/10.94/10.26 < 0.001 [48]
PD CC 425/460 12.09/12.3 3.73/3.15 8.36/9.15 <0.05 [47]
SCI CC 343/2522 8.3/10.7 < 0.001 [88]
SCZ CC 34/114 9.74/11.14 0.04 [41]
SCZ CC 72/65 6.5/12.2 10 -13 [42]
SCZ vs. BD CC 71/BD: 69 10.62/8.04* 7.87/5.47** *0.02 [26]
**0.03
SCZ vs. BD CS 50/BD: 43 8.89/7.01 a 6.84/4.45 b a 0.027 [27]
b 0.004
SCZ vs. BD CS 44/BD: 56 7.01/4.95 < 0.0001 [25]
SCZ vs. SAD CS 44/SAD: 99 7.01/5.81 < 0.03
DDis: specification of the disease; Ctrl: specification of the controls or group of comparison (for detail see each study). When unspecified
= healthy population; TSB: total serum bilirubin (mmol/L); CB: conjugated bilirubin or direct bilirubin (DB, mmol/L); UCB: unconjugated
bilirubin or indirect bilirubin (IB, mmol/L); AD: alzheimer disease; ALS: amyotrophic lateral sclerosis; BD: bipolar disorders; CIS: clinically
isolated syndrome; DEM: dementia, Cogn.Imp: subject with DEM and cognitive impairment; No Cogn.Imp: subject with DEM but not
cognitive impairment; DR: diabetic retinopathy; HS: healthy subjects; MC-AD: mild cognitive Alzheimer disease; MS: multiple sclerosis;
NO: neuritis optica; NMO: neuromyelitis optica; pAD: probable Alzheimer disease; PD: parkinson disease; LD-PD: L-Dopa treated PD
patients; Untr.PD: untreated PD patients; SAD: schizoaffective disorder; SCI: silent cerebral infarct; SCZ: schizophrenia; CC: case control;
**,b
*,a
CS: cross-sectional. P value for TSB, P value for UCB
[25]
More interestingly, after antipsychotic treatment, UCB decreases in 80% of subjects. Gama Marques et al.
also reported that mean UCB levels are clearly higher in patients with schizophrenia than patients with
schizoaffective disorder and bipolar disorder. Additionally, retrospective and recent prospective studies
indicate that serum UCB level in patients with schizophrenia is higher than those with bipolar affective
disorder (1.40- and 1.53-fold, respectively) [26,27] . Notably, all these studies included only subjects with
normal liver enzymes and no pre-existing liver disease or other confounding factors, further emphasizing
the pivotal role of UCB increase. UCB can be viewed as a potential biomarker to distinguish schizophrenia
[28]
from other psychiatric disorders .
UCB level also shows a correlation with schizophrenia symptoms. Patients with hyperbilirubinemia have
shown significantly higher scores on the positive and general psychiatric subscales of the PANSS (Positive
[24]
and Negative Syndrome Scale) . In concordance with the previous finding, UCB elevation has been found
[26]
frequently in psychotic episodes of schizophrenia [25,29] . Radhakrishnan et al. reported that UCB levels
are higher in paranoid schizophrenia than non-paranoid schizophrenia. Meanwhile, a recent study by
Pradeep et al. found no association between serum UCB levels with the severity of psychopathology in
[27]
schizophrenia subjects.
Schizophrenic subjects with unconjugated hyperbilirubinemia show a significant enlargement of cerebral
ventricles and abnormalities of brain metabolism compared to both normobilirubinemic schizophrenia
[30]
[31]
patients and normal controls . Neuroinflammation in schizophrenia is characterized by increased serum
concentrations of proinflammatory cytokines, including IL1β, IL6, and transforming growth factor-β