
Page 48 - Read Online
P. 48
Page 44 Astorino et al. Neuroimmunol Neuroinflammation 2020;7:40-50 I http://dx.doi.org/10.20517/2347-8659.2019.11
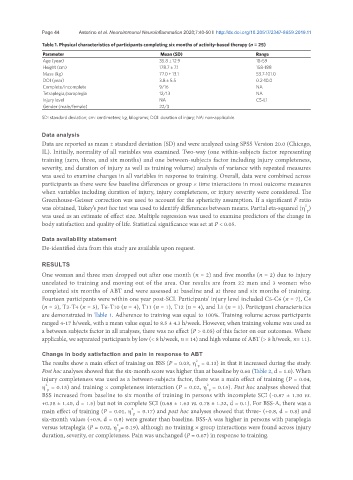
Table 1. Physical characteristics of participants completing six months of activity-based therapy (n = 25)
Parameter Mean (SD) Range
Age (year) 35.8 ± 12.9 18-59
Height (cm) 178.7 ± 7.1 158-188
Mass (kg) 77.0 ± 13.1 53.7-101.0
DOI (year) 3.8 ± 5.5 0.2-10.0
Complete/incomplete 9/16 NA
Tetraplegia/paraplegia 12/13 NA
Injury level NA C5-L1
Gender (male/female) 22/3
SD: standard deviation; cm: centimeters; kg, kilograms; DOI: duration of injury; NA: non-applicable
Data analysis
Data are reported as mean ± standard deviation (SD) and were analyzed using SPSS Version 20.0 (Chicago,
IL). Initially, normality of all variables was examined. Two-way (one within-subjects factor representing
training (zero, three, and six months) and one between-subjects factor including injury completeness,
severity, and duration of injury as well as training volume) analysis of variance with repeated measures
was used to examine changes in all variables in response to training. Overall, data were combined across
participants as there were few baseline differences or group × time interactions in most outcome measures
when variables including duration of injury, injury completeness, or injury severity were considered. The
Greenhouse-Geisser correction was used to account for the sphericity assumption. If a significant F ratio
was obtained, Tukey’s post hoc test was used to identify differences between means. Partial eta-squared (η )
2
p
was used as an estimate of effect size. Multiple regression was used to examine predictors of the change in
body satisfaction and quality of life. Statistical significance was set at P < 0.05.
Data availability statement
De-identified data from this study are available upon request.
RESULTS
One woman and three men dropped out after one month (n = 2) and five months (n = 2) due to injury
unrelated to training and moving out of the area. Our results are from 22 men and 3 women who
completed six months of ABT and were assessed at baseline and at three and six months of training.
Fourteen participants were within one year post-SCI. Participants’ injury level included C5-C6 (n = 7), C4
(n = 3), T3-T4 (n = 5), T6-T10 (n = 4), T11 (n = 1), T12 (n = 4), and L1 (n = 1). Participant characteristics
are demonstrated in Table 1. Adherence to training was equal to 100%. Training volume across participants
ranged 4-17 h/week, with a mean value equal to 8.5 ± 4.3 h/week. However, when training volume was used as
a between subjects factor in all analyses, there was no effect (P > 0.05) of this factor on our outcomes. Where
applicable, we separated participants by low (< 8 h/week, n = 14) and high volume of ABT (> 8 h/week, n= 11).
Change in body satisfaction and pain in response to ABT
2
The results show a main effect of training on BSS (P = 0.03, η = 0.13) in that it increased during the study.
p
Post hoc analyses showed that the six-month score was higher than at baseline by 0.60 (Table 2, d = 1.0). When
injury completeness was used as a between-subjects factor, there was a main effect of training (P = 0.04,
2
2
η = 0.13) and training × completeness interaction (P = 0.02, η = 0.15). Post hoc analyses showed that
p
p
BSS increased from baseline to six months of training in persons with incomplete SCI (-0.87 ± 1.30 vs.
+0.38 ± 1.40, d = 1.5) but not in complete SCI (0.68 ± 1.63 vs. 0.78 ± 1.32, d = 0.1). For BSS-A, there was a
2
main effect of training (P = 0.01, η = 0.17) and post hoc analyses showed that three- (+0.8, d = 0.8) and
p
six-month values (+0.9, d = 0.8) were greater than baseline. BSS-A was higher in persons with paraplegia
versus tetraplegia (P = 0.02, η = 0.19), although no training × group interactions were found across injury
2
p
duration, severity, or completeness. Pain was unchanged (P = 0.67) in response to training.