
Page 660 - Read Online
P. 660
Benito-González et al. Mini-invasive Surg 2020;4:67 I http://dx.doi.org/10.20517/2574-1225.2020.54 Page 5 of 9
Table 2. Short-term procedural outcomes
All patients (n = 70) Frail (n = 27) Non frail (n = 43) P value
Days of admission 4 [4-5] 4 [4-5] 4 [4-5] 0.625
Procedure Device time (min) 62.5 [45.0-86.0] 70.0 [42.0-95.0] 60.0 [45.0-85.0] 0.749
Fluoroscopy time (min) 40.8 [34.3-50.0] 43.4 [34.4-54.0] 40.4 [34.1-50.0] 0.768
Number of clips 1 [1-2] 1 [1-2] 1 [1-2] 0.359
Emergent cardiac surgery (%) 1.4 0 2.3 1.0
Procedural death (%) 0 0 0 1.0
Technical success (%) 98.6 100 97.7 1.0
30-day Cardiovascular intervention (%) 4.3 0 7.0 0.279
Stroke (%) 0 0 0 1.0
Transient ischemic attack (%) 2.9 3.7 2.3
Major vascular complication (%) 2.9 3.7 2.3 1.0
Major structural complication (%) 0 0 0 1.0
Major bleeding (%) 7.1 11.1 4.7 0.367
Life-threatening or fatal bleeding (%) 0 0 0 1.0
Acute kidney injury grade 2 or 3 (%) 0 0 0 1.0
Death (%) 1.4 3.7 0 0.386
Structural failure (%) 1.4 3.7 0 0.386
Functional failure (%) 8.6 11.1 7.0 0.670
Device success (%) 84.3 81.5 86.1 0.739
P P
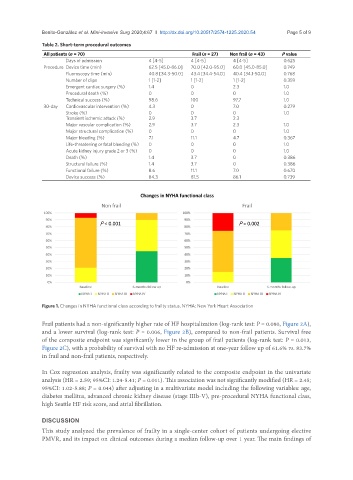
Figure 1. Changes in NYHA functional class according to frailty status. NYHA: New York Heart Association
Frail patients had a non-significantly higher rate of HF hospitalization (log-rank test: P = 0.080, Figure 2A),
and a lower survival (log-rank test: P = 0.006, Figure 2B), compared to non-frail patients. Survival free
of the composite endpoint was significantly lower in the group of frail patients (log-rank test: P = 0.013,
Figure 2C), with a probability of survival with no HF re-admission at one-year follow up of 61.6% vs. 83.7%
in frail and non-frail patients, respectively.
In Cox regression analysis, frailty was significantly related to the composite endpoint in the univariate
analysis (HR = 2.59; 95%CI: 1.24-5.41; P = 0.011). This association was not significantly modified (HR = 2.45;
95%CI: 1.02-5.88; P = 0.044) after adjusting in a multivariate model including the following variables: age,
diabetes mellitus, advanced chronic kidney disease (stage IIIb-V), pre-procedural NYHA functional class,
high Seattle HF risk score, and atrial fibrillation.
DISCUSSION
This study analyzed the prevalence of frailty in a single-center cohort of patients undergoing elective
PMVR, and its impact on clinical outcomes during a median follow-up over 1 year. The main findings of