
Page 73 - Read Online
P. 73
Page 4 of 7 Sugihara et al. Mini-invasive Surg 2018;2:11 I http://dx.doi.org/10.20517/2574-1225.2018.14
270
Laparoscopic time (min) 260
250
240
0 14 28 42 56 70
Interval of laparoscopic nephrectomy/nephroureterectomy (days)
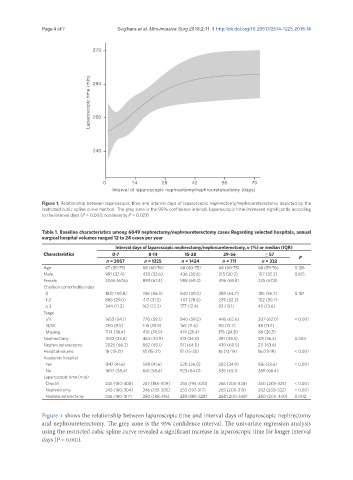
Figure 1. Relationship between laparoscopic time and interval days of laparoscopic nephrectomy/nephroureterectomy depicted by the
restricted cubic spline curve method. The grey zone is the 95% confidence interval. Laparoscopic time increased significantly according
to the interval days (P = 0.003; nonlinearity P = 0.021)
Table 1. Baseline characteristics among 6849 nephrectomy/nephroureterectomy cases Regarding selected hospitals, annual
surgical hospital volumes ranged 12 to 24 cases per year
Interval days of laparoscopic nephrectomy/nephroureterectomy, n (%) or median (IQR)
Characteristics 0-7 8-14 15-28 29-56 ≥ 57 P
n = 3057 n = 1325 n = 1424 n = 711 n = 332
Age 67 (59-75) 68 (60-76) 68 (60-75) 68 (60-75) 68 (59-76) 0.126
Male 991 (32.4) 432 (32.6) 436 (30.6) 215 (30.2) 107 (32.2) 0.615
Female 2066 (67.6) 893 (67.4) 988 (69.4) 496 (69.8) 225 (67.8)
Charlson comorbidity index
0 1827 (59.8) 746 (56.3) 840 (59.0) 389 (54.7) 185 (55.7) 0.187
1-2 886 (29.0) 417 (31.5) 407 (28.6) 229 (32.2) 102 (30.7)
≥ 3 344 (11.3) 162 (12.2) 177 (12.4) 93 (13.1) 45 (13.6)
Stage
I/II 1653 (54.1) 770 (58.1) 840 (59.0) 445 (62.6) 207 (62.0) < 0.001
III/IV 290 (9.5) 145 (10.9) 165 (11.6) 90 (12.7) 38 (11.4)
Missing 1114 (36.4) 410 (30.9) 419 (29.4) 176 (24.8) 88 (26.5)
Nephrectomy 1032 (33.8) 463 (34.9) 513 (36.0) 281 (39.5) 121 (36.4) 0.054
Nephroureterectomy 2025 (66.2) 862 (65.1) 911 (64.0) 430 (60.5) 211 (63.6)
Hospital volume 18 (15-21) 18 (15-21) 17 (15-20) 16 (14-19) 16 (13-19) < 0.001
Academic hospital
Yes 1147 (41.6) 598 (41.6) 520 (36.0) 282 (34.9) 136 (33.6) < 0.001
No 1607 (58.4) 841 (58.4) 923 (64.0) 526 (65.1) 269 (66.4)
Laparoscopic time (min)
Overall 245 (180-308) 247 (186-309) 255 (194-320) 265 (200-328) 260 (205-325) < 0.001
Nephrectomy 245 (180-304) 246 (185-305) 255 (197-317) 265 (200-319) 262 (208-322) < 0.001
Nephroureterectomy 245 (180-317) 250 (188-316) 255 (189-328) 268 (200-348) 260 (200-340) 0.002
Figure 1 shows the relationship between laparoscopic time and interval days of laparoscopic nephrectomy
and nephroureterectomy. The grey zone is the 95% confidence interval. The univariate regression analysis
using the restricted cubic spline curve revealed a significant increase in laparoscopic time for longer interval
days (P = 0.001).