
Page 77 - Read Online
P. 77
Page 8 Moore et al. J Transl Genet Genom 2021;5:200-217 https://dx.doi.org/10.20517/jtgg.2021.08
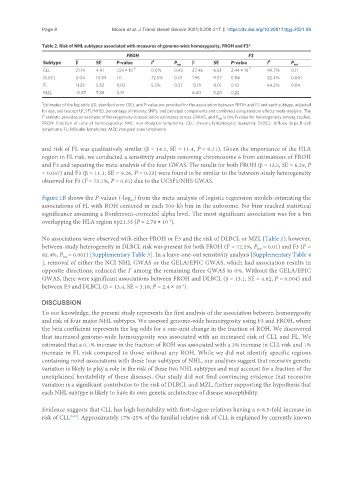
Table 2. Risk of NHL subtypes associated with measures of genome-wide homozygosity, FROH and F3*
FROH F3
Subtype β SE P-value I 2 P het β SE P-value I 2 P het
CLL 21.14 4.41 1.59 × 10 -6 0.0% 0.42 27.46 6.51 2.44 × 10 -5 49.7% 0.11
DLBCL 0.04 10.89 1.0 72.5% 0.01 1.96 9.57 0.84 82.4% 0.001
FL 11.39 5.82 0.02 5.3% 0.37 13.19 8.01 0.10 64.2% 0.04
MZL -0.87 7.88 0.91 6.40 5.20 0.22
*
Estimates of the log odds (β), standard error (SE), and P-value are provided for the association between FROH and F3 and each subtype, adjusted
for age, sex (except UCSF1/NHS), percentage of missing SNPs, and principal components and combined using random effects meta-analysis. The
2
I statistic provides an estimate of heterogeneity in association estimates across GWAS, and P is the P-value for heterogeneity among studies.
het
FROH: Fraction of runs of homozygosity; NHL: non-Hodgkin lymphoma; CLL: chronic lymphocytic leukemia; DLBCL: diffuse large B-cell
lymphoma; FL: follicular lymphoma; MZL: marginal zone lymphoma.
and risk of FL was qualitatively similar (β = 14.1, SE = 11.4, P = 0.21). Given the importance of the HLA
region in FL risk, we conducted a sensitivity analysis removing chromosome 6 from estimations of FROH
and F3 and repeating the meta-analysis of the four GWAS. The results for both FROH (β = 12.5, SE = 6.29, P
= 0.047) and F3 (β = 11.1, SE = 9.26, P = 0.23) were found to be similar to the between-study heterogeneity
2
observed for F3 (I = 73.1%, P = 0.01) due to the UCSF1/NHS GWAS.
Figure 1B shows the P-values (-log ) from the meta-analysis of logistic regression models estimating the
10
associations of FL with ROH centered in each 500-kb bin in the autosome. No bins reached statistical
significance assuming a Bonferroni-corrected alpha level. The most significant association was for a bin
overlapping the HLA region 6p21.33 (P = 2.78 × 10 ).
-3
No associations were observed with either FROH or F3 and the risk of DLBCL or MZL [Table 2]; however,
2
between-study heterogeneity in DLBCL risk was present for both FROH (I = 72.5%, P = 0.01) and F3 (I =
2
het
82.4%, P = 0.001) [Supplementary Table 3]. In a leave-one-out sensitivity analysis [Supplementary Table 4
het
], removal of either the NCI NHL GWAS or the GELA/EPIC GWAS, which had association results in
opposite directions, reduced the I among the remaining three GWAS to 0%. Without the GELA/EPIC
2
GWAS, there were significant associations between FROH and DLBCL (β = 13.1, SE = 4.62, P = 0.004) and
between F3 and DLBCL (β = 13.4, SE = 3.18, P = 2.4 × 10 ).
-5
DISCUSSION
To our knowledge, the present study represents the first analysis of the association between homozygosity
and risk of four major NHL subtypes. We assessed genome-wide homozygosity using F3 and FROH, where
the beta coefficient represents the log odds for a one-unit change in the fraction of ROH. We discovered
that increased genome-wide homozygosity was associated with an increased risk of CLL and FL. We
estimated that a 0.1% increase in the fraction of ROH was associated with a 2% increase in CLL risk and 1%
increase in FL risk compared to those without any ROH. While we did not identify specific regions
containing novel associations with these four subtypes of NHL, our analyses suggest that recessive genetic
variation is likely to play a role in the risk of these two NHL subtypes and may account for a fraction of the
unexplained heritability of these diseases. Our study did not find convincing evidence that recessive
variation is a significant contributor to the risk of DLBCL and MZL, further supporting the hypothesis that
each NHL subtype is likely to have its own genetic architecture of disease susceptibility.
Evidence suggests that CLL has high heritability with first-degree relatives having a 6-8.5-fold increase in
risk of CLL [5,34] . Approximately 17%-25% of the familial relative risk of CLL is explained by currently known