
Page 104 - Read Online
P. 104
Salmani et al. J Surveill Secur Saf 2020;1:79–101 I http://dx.doi.org/10.20517/jsss.2020.16 Page 97
Standard Deviation Deduction
Entropy Improvement 100%
80%
90%
70%
80%
60% 70%
Improvement 50% Deduction 60%
50%
40%
40%
30%
20% 30%
20%
10% 10%
0 0
0 1 2 3 4 5 6 7 8 9 10 11 12 13 14 15 16 17 18 19 20 21 0 1 2 3 4 5 6 7 8 9 10 11 12 13 14 15 16 17 18 19 20 21
Documents Documents
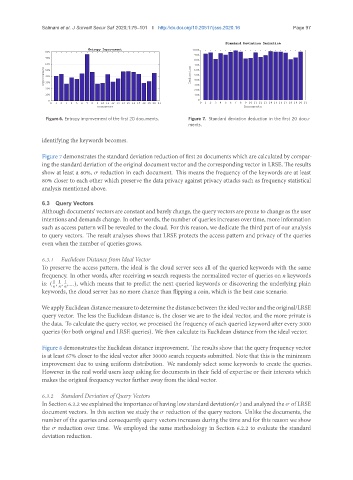
Figure 6. Entropy improvement of the first 20 documents. Figure 7. Standard deviation deduction in the first 20 docu-
ments.
identifying the keywords becomes.
Figure 7 demonstrates the standard deviation reduction of first 20 documents which are calculated by compar-
ing the standard deviation of the original document vector and the corresponding vector in LRSE. The results
show at least a 80%, σ reduction in each document. This means the frequency of the keywords are at least
80% closer to each other which preserve the data privacy against privacy attacks such as frequency statistical
analysis mentioned above.
6.3 Query Vectors
Although documents’ vectors are constant and barely change, the query vectors are prone to change as the user
intentions and demands change. In other words, the number of queries increases over time, more information
such as access pattern will be revealed to the cloud. For this reason, we dedicate the third part of our analysis
to query vectors. The result analyses shows that LRSE protects the access pattern and privacy of the queries
even when the number of queries grows.
6.3.1 Euclidean Distance from Ideal Vector
To preserve the access pattern, the ideal is the cloud server sees all of the queried keywords with the same
frequency. In other words, after receiving m search requests the normalized vector of queries on n keywords
is: ( , , ,...), which means that to predict the next queried keywords or discovering the underlying plain
1 1 1
n n n
keywords, the cloud server has no more chance than flipping a coin, which is the best case scenario.
WeapplyEuclideandistancemeasuretodeterminethedistancebetweentheidealvectorandtheoriginal/LRSE
query vector. The less the Euclidean distance is, the closer we are to the ideal vector, and the more private is
the data. To calculate the query vector, we processed the frequency of each queried keyword after every 3000
queries (for both original and LRSE queries). We then calculate its Euclidean distance from the ideal vector.
Figure 8 demonstrates the Euclidean distance improvement. The results show that the query frequency vector
is at least 67% closer to the ideal vector after 30000 search requests submitted. Note that this is the minimum
improvement due to using uniform distribution. We randomly select some keywords to create the queries.
However in the real world users keep asking for documents in their field of expertise or their interests which
makes the original frequency vector farther away from the ideal vector.
6.3.2 Standard Deviation of Query Vectors
In Section 6.2.2 we explained the importance of having low standard deviation(σ) and analyzed the σ of LRSE
document vectors. In this section we study the σ reduction of the query vectors. Unlike the documents, the
number of the queries and consequently query vectors increases during the time and for this reason we show
the σ reduction over time. We employed the same methodology in Section 6.2.2 to evaluate the standard
deviation reduction.